Data snapshot
Australia Fuel Prices — 24 July 2026
National fuel price data for Australia as at 24 July 2026. Petrol national average 185.7¢/L · Diesel 223.6¢/L.
FuelRadar data desk · 24 July 2026
The national fuel price briefing
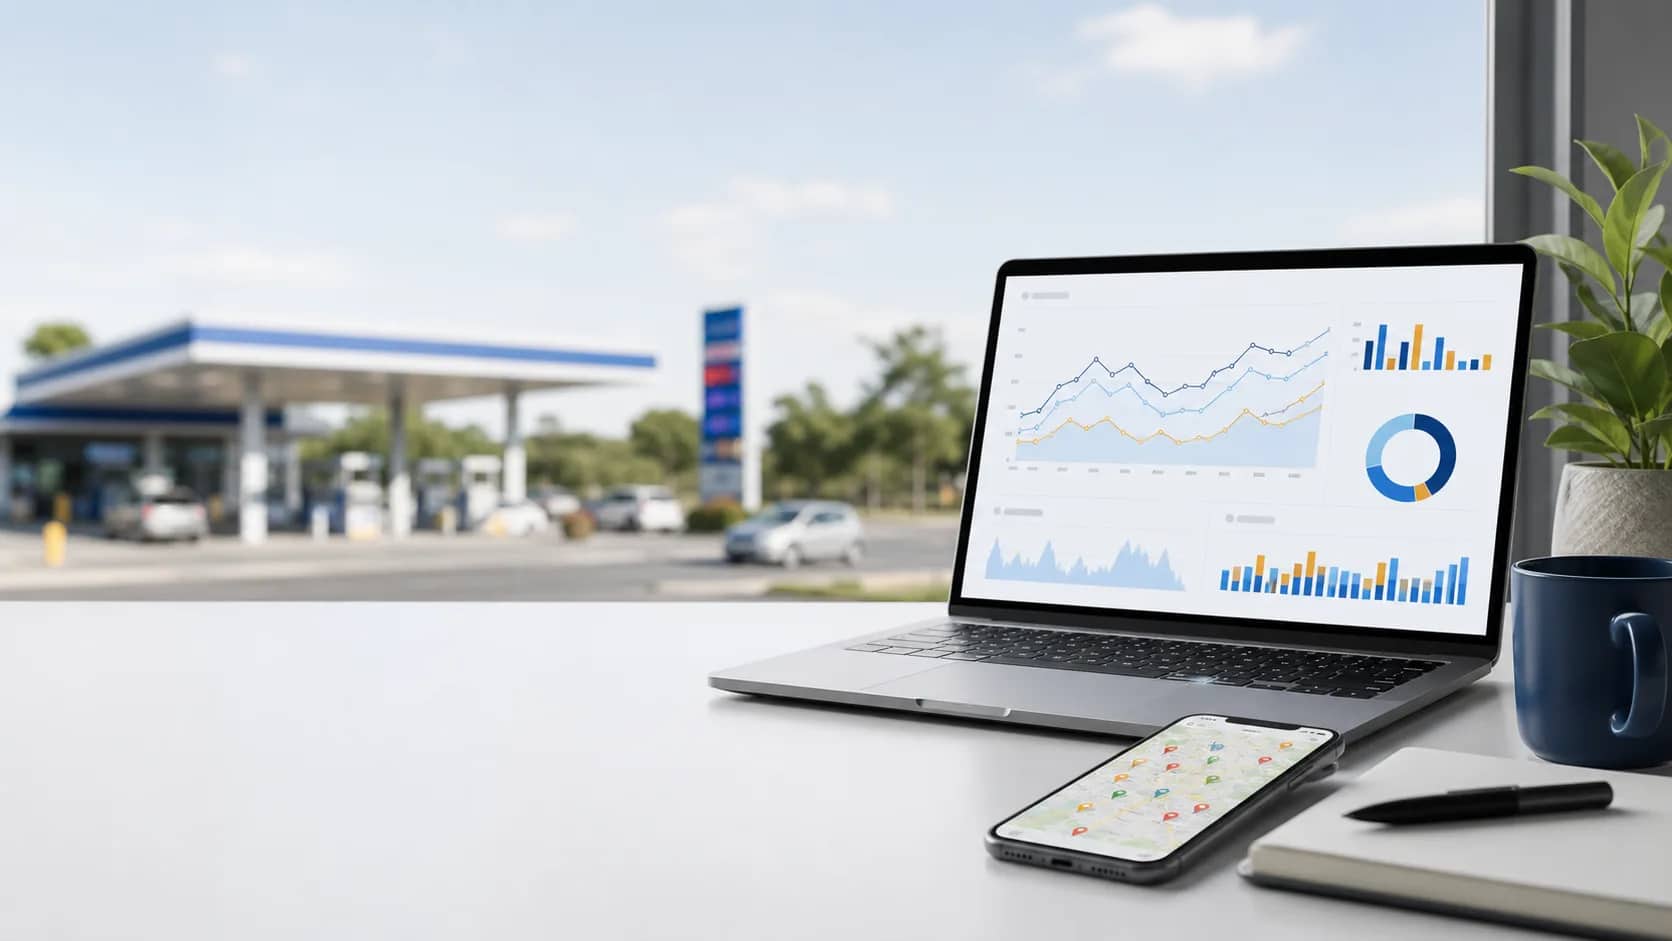
A publication-ready view of reported pump prices across Australia, built from 8,081 reporting service stations. Inspect the trend, compare fuel grades and capitals, then download or cite the underlying figures.
- U91 national average
- 185.7¢/L
- Diesel national average
- 223.6¢/L
- Reporting stations
- 8,081
- Report date
- 24 July 2026
Price movement
How reported prices have moved
Change the period, fuel grade or state. The finding updates with the selection, while the chart keeps the full time series visible for context.
Interactive time series
Australia multi-fuel trend
Daily reported averages can move as participating feeds refresh. A market average is context, not a guaranteed bowser price at every station.
- Latest update
- 24 July 2026, 12:00 am
- Evidence base
- 0 daily observations
What the data says
Trend data for Australia is not available for the selected period.
Source: FuelRadar station reports and supported government and retailer feeds
Method: Daily averages use available station observations for each grade. Coverage and source update cadence vary by market. Full methodology
Download or cite
Permanent reportFuel grade comparison
National averages, lows and highs
The spread between the lowest and highest report shows why checking nearby stations can matter more than relying on one national number.
National price table
Australia fuel averages — 24 July 2026
Select a fuel type in the first column to focus the trend above. Download the displayed rows as CSV for analysis or publication.
- Latest update
- 24 July 2026, 12:00 am
- Evidence base
- 8,081 reporting stations
What the data says
Diesel has the widest published low-to-high range at 120.1¢/L.
Select a fuel type in the first column to focus the trend above. Download the displayed rows as CSV for analysis or publication.
Swipe across to compare every column.
| Fuel type | National average | Lowest reported | Highest reported | Stations |
|---|---|---|---|---|
| 185.7¢ | 155.9¢ | 259.9¢ | 6,969 | |
| 181.1¢ | 159.3¢ | 230.0¢ | 2,897 | |
| 223.6¢ | 169.9¢ | 290.0¢ | 4,478 | |
| 226.4¢ | 187.7¢ | 265.9¢ | 4,316 | |
| 201.3¢ | 171.3¢ | 275.0¢ | 4,298 | |
| 209.3¢ | 179.9¢ | 280.9¢ | 6,039 | |
| 106.8¢ | 84.9¢ | 187.4¢ | 764 |
Source: FuelRadar station reports and supported government and retailer feeds
Method: Prices are in cents per litre. Each mean, low and high uses currently available station reports for that fuel grade; coverage and update cadence vary by source. Full methodology
Download or cite
Permanent reportCapital city comparison
What drivers are seeing around the capitals
Compare U91 and diesel averages, then use the difference column to see whether each capital sits above or below the national U91 average.
City table
U91 and diesel by capital city
The national U91 comparison point is 185.7¢/L. Filter by state or territory without changing the exported column definitions.
- Latest update
- 24 July 2026, 12:00 am
- Evidence base
- 8 capital cities
What the data says
Melbourne has the lowest reported capital-city U91 average at 181.8¢/L; Darwin is highest at 204.7¢/L.
The national U91 comparison point is 185.7¢/L. Filter by state or territory without changing the exported column definitions.
Swipe across to compare every column.
| Capital city | U91 average | Diesel average | U91 vs national |
|---|---|---|---|
| SydneyNSW | 185.1¢ | 224.4¢ | -0.6¢ |
| MelbourneVIC | 181.8¢ | 220.0¢ | -3.9¢ |
| BrisbaneQLD | 186.4¢ | 223.7¢ | +0.7¢ |
| PerthWA | 188.8¢ | 222.6¢ | +3.1¢ |
| AdelaideSA | 186.2¢ | 224.4¢ | +0.5¢ |
| HobartTAS | 189.3¢ | 226.0¢ | +3.6¢ |
| CanberraACT | 190.7¢ | 226.2¢ | +5.0¢ |
| DarwinNT | 204.7¢ | 238.5¢ | +19.0¢ |
Source: FuelRadar capital-city station reports
Method: Capital-city values are mean reported pump prices for available stations in each market. Full methodology
Download or cite
Permanent report334 stations reporting out of stock
Last checked 24 July 2026. Counts include all fuel types and can change as station reports update.
Open the outage reportFor media and research
Copy, download and publish
Use the prepared citation, permanent links and approved brand assets when reporting FuelRadar data.
Ready-to-cite data
A clean source line for the newsroom
Copy this text into a story or research note, retain the date and link to the permanent report.
Unleaded 91 national average: 185.7¢/L
Diesel national average: 223.6¢/L
Stations reporting out-of-stock: 334
Source: FuelRadar (https://fuelradar.com.au/fuel-data) — 24 July 2026
Approved assets
FuelRadar logos and colours
Publication palette
Brand colours
Action blue
#215DB3
Navy
#173B74
Gold
#EFC84A
Attribution guidelines
- Include “Source: FuelRadar” and the permanent report link beside published figures.
- Do not alter, recolour or distort the FuelRadar logo or wordmark.
Media enquiries: [email protected]
Method and responsibility
How FuelRadar Australia reports these prices
Every number on this page is tied to a reporting period, evidence base and source note so readers can judge it before reusing it.
Coverage. FuelRadar Australia tracks reported pump prices across 8,081 service stations in Australia. Availability varies by jurisdiction, retailer and fuel grade.
Interpretation. State and city values are means across available reports. The low and high show the observed range, not a promise that a price remains available when a driver arrives.
Freshness. Feeds update at different intervals. Check a station’s displayed update time on the map before making a special trip.
Need to verify a figure?
Read the calculation notes or open the map to check current station reports.