Use the P98 average as a benchmark
South Australia is averaging 232.9 c/L for P98. Adelaide is the lowest-priced major city in this view at 232.5 c/L. Whitwarta 5461 is one of the lower-priced suburbs at 214.9 c/L.

State fuel prices
Premium 98 in South Australia from 212.7c/L, averaging 232.9c/L across 534 stations. Lowest reported average in Whitwarta (214.9c/L avg).
South Australia average
232.9c

WAIT
South Australia averages 232.9 c/L for Premium 98.
The latest Adelaide model suggests prices could fall by about 45.4 c/L near the next low. Timing can shift; compare current station reports if you need fuel today.
State benchmark
Fuel grades
Compare grades across South Australia, then open the one your vehicle uses.
Low 212.7 c/L · 534 stations
Low 234.9 c/L · 352 stations
Low 194.7 c/L · 48 stations
Low 95.9 c/L · 90 stations
Low 206.4 c/L · 348 stations
Low 232.7 c/L · 380 stations
Low 188.9 c/L · 611 stations
Major cities
Open a city page for cheaper suburbs, brands and station prices in South Australia.
Cheapest suburbs
The local areas pulling the P98 average down. Cheapest first, delta vs the South Australia average.
214.9c
-18.0vs state222.9c
-10.0vs state224.3c
-8.6vs state225.5c
-7.4vs state225.6c
-7.3vs state226.2c
-6.7vs state226.5c
-6.4vs state227.3c
-5.6vs state228.2c
-4.7vs state228.3c
-4.6vs state228.4c
-4.5vs state228.4c
-4.5vs stateBrand averages
Brand averages help, but the suburb and station pages show whether a retailer is competitive where you drive.
Low 219.5 c/L · 10 stations · 1.4% share

Low 221.5 c/L · 5 stations · 0.7% share

Low 222.5 c/L · 12 stations · 1.7% share

Low 221.7 c/L · 29 stations · 4.1% share

Low 221.5 c/L · 45 stations · 6.4% share
Low 220.5 c/L · 33 stations · 4.7% share

Low 225.5 c/L · 18 stations · 2.6% share

Low 225.9 c/L · 27 stations · 3.9% share
Low 214.9 c/L · 34 stations · 4.9% share
90-day reported history
Use the chart for the movement and the expandable table for exact daily averages. A local average is context, not a guaranteed bowser price at every station.
The values used in the figure are listed below.
| Date | Average (c/L) | Change (c) |
|---|---|---|
| 11 May 2026 | 206.6c/L | 0.0 |
| 12 May 2026 | 202.5c/L | -4.1 |
| 13 May 2026 | 202.9c/L | -3.7 |
| 14 May 2026 | 201.5c/L | -5.1 |
| 15 May 2026 | 210.4c/L | +3.8 |
| 16 May 2026 | 207.1c/L | +0.5 |
| 17 May 2026 | 201.5c/L | -5.1 |
| 18 May 2026 | 206.7c/L | +0.1 |
| 19 May 2026 | 206.6c/L | 0.0 |
| 20 May 2026 | 202.9c/L | -3.7 |
| 21 May 2026 | 202.0c/L | -4.6 |
| 22 May 2026 | 208.3c/L | +1.7 |
| 23 May 2026 | 211.1c/L | +4.5 |
| 24 May 2026 | 197.5c/L | -9.1 |
| 25 May 2026 | 199.2c/L | -7.4 |
| 26 May 2026 | 205.4c/L | -1.2 |
| 27 May 2026 | 200.1c/L | -6.5 |
| 28 May 2026 | 201.4c/L | -5.2 |
| 29 May 2026 | 199.9c/L | -6.7 |
| 30 May 2026 | 199.3c/L | -7.3 |
| 31 May 2026 | 198.9c/L | -7.7 |
| 1 June 2026 | 198.8c/L | -7.8 |
| 2 June 2026 | 195.8c/L | -10.8 |
| 3 June 2026 | 192.7c/L | -13.9 |
| 4 June 2026 | 187.8c/L | -18.8 |
| 5 June 2026 | 190.8c/L | -15.8 |
| 6 June 2026 | 189.9c/L | -16.7 |
| 7 June 2026 | 185.5c/L | -21.1 |
| 8 June 2026 | 197.4c/L | -9.2 |
| 9 June 2026 | 187.6c/L | -19.0 |
| 10 June 2026 | 187.5c/L | -19.1 |
| 11 June 2026 | 186.0c/L | -20.6 |
| 12 June 2026 | 182.8c/L | -23.8 |
| 13 June 2026 | 182.3c/L | -24.3 |
| 14 June 2026 | 182.2c/L | -24.4 |
| 15 June 2026 | 190.7c/L | -15.9 |
| 16 June 2026 | 189.1c/L | -17.5 |
| 17 June 2026 | 187.7c/L | -18.9 |
| 18 June 2026 | 185.2c/L | -21.4 |
| 19 June 2026 | 182.8c/L | -23.8 |
| 20 June 2026 | 177.9c/L | -28.7 |
| 21 June 2026 | 180.8c/L | -25.8 |
| 22 June 2026 | 183.2c/L | -23.4 |
| 23 June 2026 | 181.6c/L | -25.0 |
| 24 June 2026 | 182.4c/L | -24.2 |
| 25 June 2026 | 180.8c/L | -25.8 |
| 26 June 2026 | 177.8c/L | -28.8 |
| 27 June 2026 | 175.6c/L | -31.0 |
| 28 June 2026 | 179.2c/L | -27.4 |
| 29 June 2026 | 179.8c/L | -26.8 |
| 30 June 2026 | 183.7c/L | -22.9 |
| 1 July 2026 | 186.8c/L | -19.8 |
| 2 July 2026 | 189.4c/L | -17.2 |
| 3 July 2026 | 194.2c/L | -12.4 |
| 4 July 2026 | 194.1c/L | -12.5 |
| 5 July 2026 | 192.0c/L | -14.6 |
| 6 July 2026 | 194.5c/L | -12.1 |
| 7 July 2026 | 192.8c/L | -13.8 |
| 8 July 2026 | 191.4c/L | -15.2 |
| 9 July 2026 | 193.2c/L | -13.4 |
| 10 July 2026 | 191.6c/L | -15.0 |
| 11 July 2026 | 194.0c/L | -12.6 |
| 12 July 2026 | 193.9c/L | -12.7 |
| 13 July 2026 | 193.9c/L | -12.7 |
| 14 July 2026 | 193.8c/L | -12.8 |
| 15 July 2026 | 193.8c/L | -12.8 |
| 16 July 2026 | 194.6c/L | -12.0 |
| 17 July 2026 | 196.4c/L | -10.2 |
| 18 July 2026 | 198.7c/L | -7.9 |
| 19 July 2026 | 199.7c/L | -6.9 |
| 20 July 2026 | 200.5c/L | -6.1 |
| 21 July 2026 | 203.1c/L | -3.5 |
| 22 July 2026 | 206.2c/L | -0.4 |
| 23 July 2026 | 209.1c/L | +2.5 |
| 24 July 2026 | 211.5c/L | +4.9 |
| 25 July 2026 | 214.3c/L | +7.7 |
| 26 July 2026 | 216.6c/L | +10.0 |
| 27 July 2026 | 218.1c/L | +11.5 |
| 28 July 2026 | 220.8c/L | +14.2 |
| 29 July 2026 | 221.5c/L | +14.9 |
| 30 July 2026 | 222.3c/L | +15.7 |
| 31 July 2026 | 223.4c/L | +16.8 |
| 1 Aug 2026 | 225.4c/L | +18.8 |
| 2 Aug 2026 | 225.2c/L | +18.6 |
| 3 Aug 2026 | 227.4c/L | +20.8 |
| 4 Aug 2026 | 233.2c/L | +26.6 |
| 5 Aug 2026 | 236.5c/L | +29.9 |
| 6 Aug 2026 | 237.4c/L | +30.8 |
| 7 Aug 2026 | 237.1c/L | +30.5 |
| 8 Aug 2026 | 236.5c/L | +29.9 |
| 9 Aug 2026 | 235.7c/L | +29.1 |
Source: Premium 98 reported pump prices
Method: Daily observations use available reported station prices. Coverage and source update cadence can vary by date and area. Full methodology
Timing · Peak phase
Lower prices modelled in about 7 days
Check the latest city price cycle and station update times before you fill.
See the price cyclePrice stability
Statewide price volatility and which fuel grades are most widely available.
Price stability
Price spread
Variation
| Fuel grade | Stations selling it |
|---|---|
| U91 | 615 |
| P98 | 535 |
| PDSL | 385 |
| DSL | 361 |
| P95 | 352 |
| LPG | 91 |
| E10 | 48 |
| E85 | 5 |
How to use this page
South Australia is averaging 232.9 c/L for the P98 benchmark.
Use the state average for context, then check a recent station price on a route you already drive.
South Australia is averaging 232.9 c/L for P98. Adelaide is the lowest-priced major city in this view at 232.5 c/L. Whitwarta 5461 is one of the lower-priced suburbs at 214.9 c/L.
Check the latest city price cycle and station update times before you fill. Prices come from SA Fuel Pricing Information Scheme; reporting times vary, so confirm the station update time before driving farther for a lower board price. Compare nearby stations on the map.
Data updated 10 Aug, 12:05 pm AEST. Source: SA Fuel Pricing Information Scheme. Based on 534 stations. State averages are context; the station report time and pump price remain the final check.
Frequently asked
The lowest reported Premium 98 in South Australia is 212.7c/L, with the state averaging 232.9c/L across 534 stations. Check each station update time before making a detour.
FuelRadar app
Save a regular station, then set a fuel target for your local area.
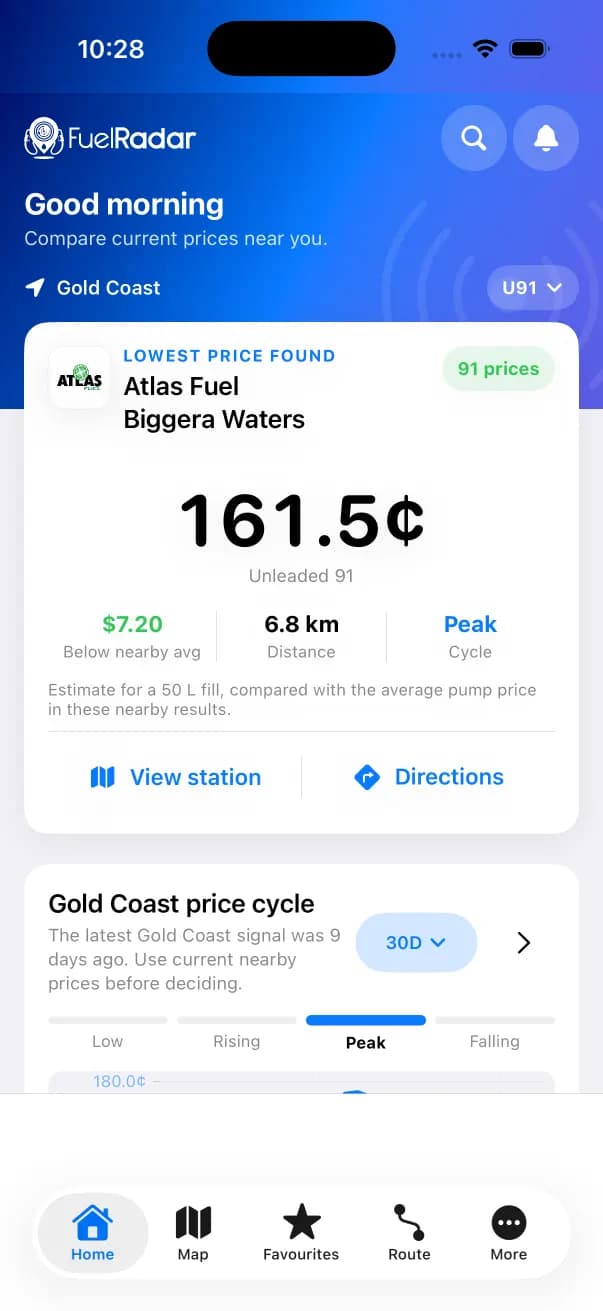
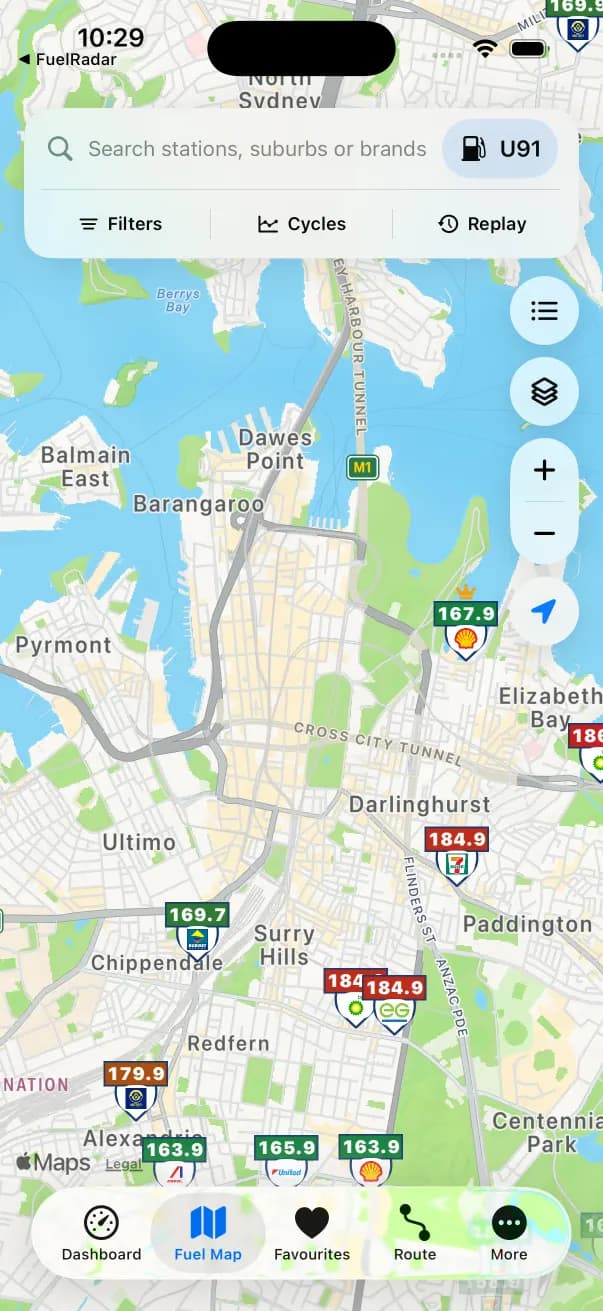
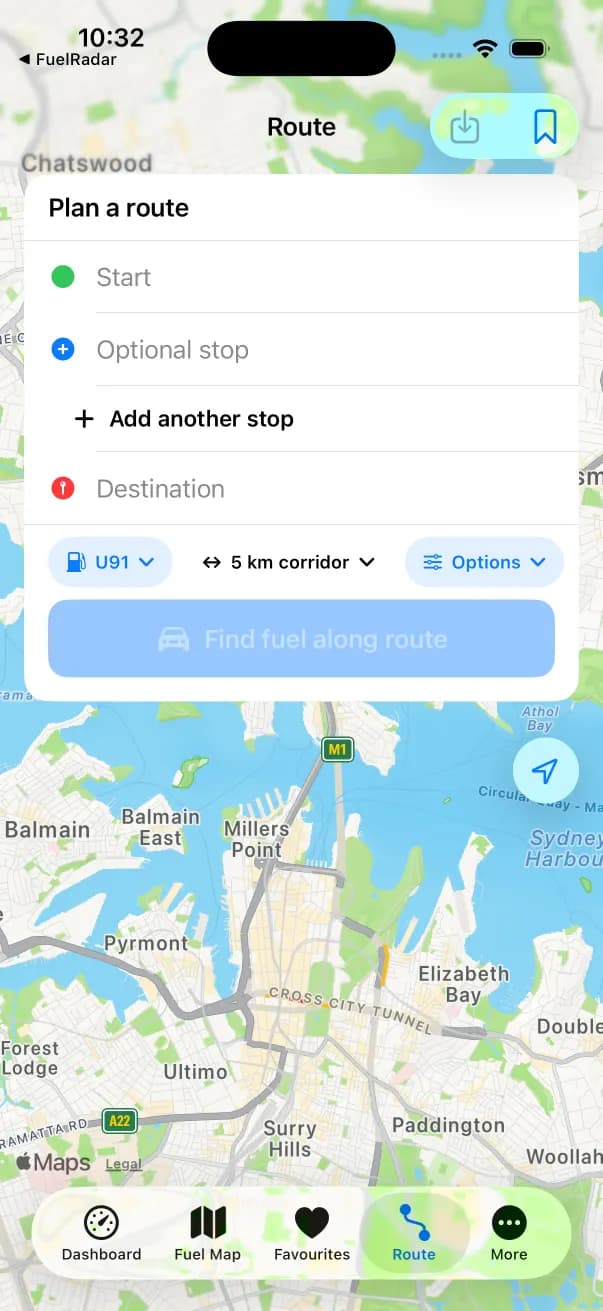
Captured from the current FuelRadar iPhone app. Prices shown are examples from the capture.