
Start with the fuel your car uses
No station directly in Culburra Beach has a recent U91 report. Compare the nearby stations shown on this page and check each update time before driving.

Suburb fuel prices
No station in Culburra Beach has a recent U91 report. Compare 2 nearby stations below and check each update time before driving.
Compare stations
No station was found directly in Culburra Beach. Compare the cheapest nearby reports by price, update age and distance.
FuelRadar
Loading fuel map
30-day price range · U91
Culburra Beach area is 9.5c/L above its 30-day average. Compare the latest station reports before choosing when to fill.
Cheapest reported U91
Source: Reported U91 pump prices across Culburra Beach area.
7-day outlook
This estimate follows the Central Coast U91 cycle and adjusts it using recent prices around Culburra Beach. Treat it as a guide, not a guaranteed bowser price.
Central Coast is in the peak phase of the current model. Treat this as guidance, not a guaranteed price path.
Culburra Beach today (est.)
201.3c/L
Central Coast 201.7c/L · -0.4c/L local
Modelled in 7 days
194.6c/L
7-day range
189.6 – 202.3c/L
Nearby suburbs
How Culburra Beach compares to neighbouring areas. Cheapest first, delta vs the Culburra Beach average.
Before you drive
Compare the same fuel type, then check the report age, distance and price difference before leaving your normal route.
A lower bowser price only saves money when the difference covers the extra fuel and time needed to reach it.
No station directly in Culburra Beach has a recent U91 report. Compare the nearby stations shown on this page and check each update time before driving.
Culburra Beach is part of Shoalhaven, within Illawarra. Compare the wider Shoalhaven market when the local report is old, out of the way or only a few cents cheaper. Before a detour, check the station report time and work out the gross saving for the litres you need. Prices for this area include reports from FuelCheck. The New South Wales state average is 201.5c.
Data updated 17 Aug, 3:54 am AEST. Source: FuelCheck. Suburb averages can hide station-level differences. Check the selected fuel grade, report time and final pump price.
Frequently asked
The lowest listed Unleaded 91 near Culburra Beach is at Ampol Breeze Shoalhaven Heads for 197.9 c/L. Check the station update time before driving.
FuelRadar app
Save a regular station, then set a fuel target for your local area.
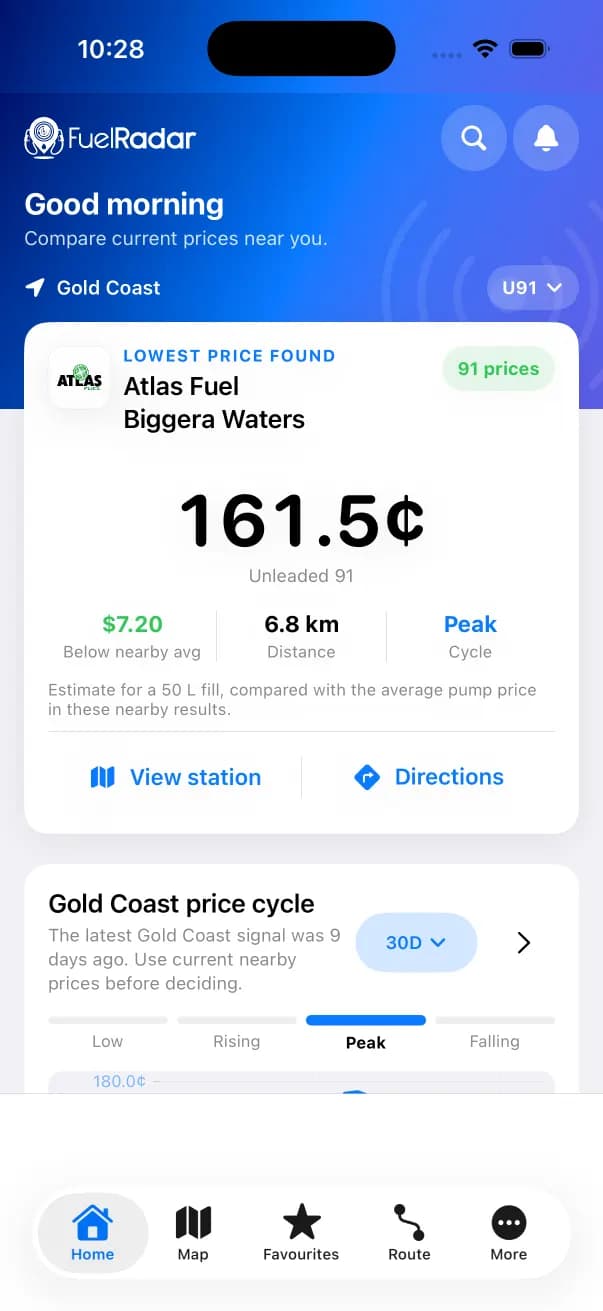
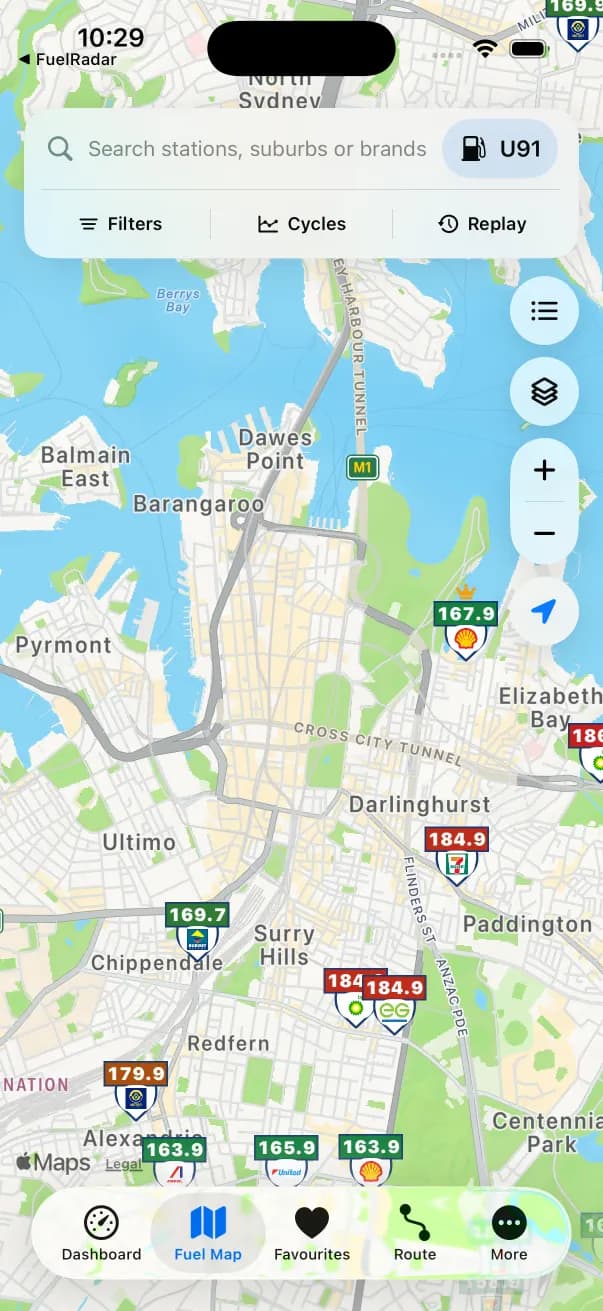
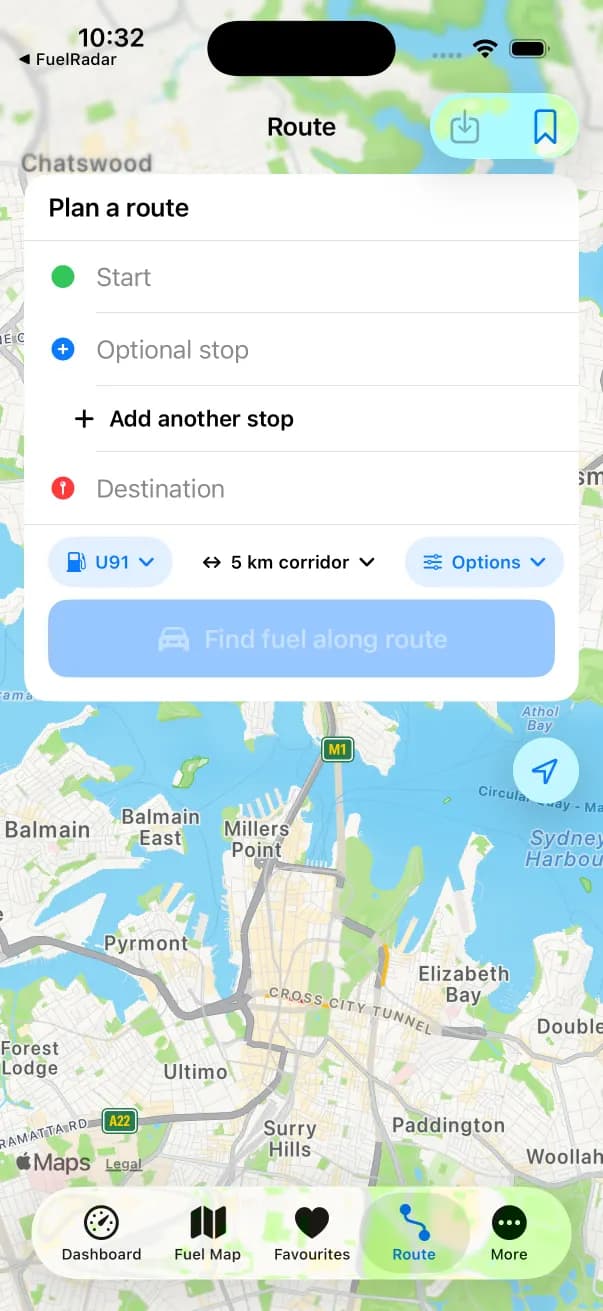
Captured from the current FuelRadar iPhone app. Prices shown are examples from the capture.