Suburb fuel prices

Fuel prices in Kings Langley, NSW

U91 starts at 199.9 c/L, with an average of 199.9 c/L across 1 tracked station directly in Kings Langley.

Station
1
Market dataUpdated 11 hr ago · FuelCheck

Local stations

Cheapest U91 stations in Kings Langley

Reported U91 prices at stations in Kings Langley, sorted lowest first. Check each report time before driving.

FuelRadar

Loading fuel map

30-day price range · U91

Kings Langley U91 price range

Kings Langley is 10.3c/L above its 30-day average. Compare the latest station reports before choosing when to fill.

30-day low
164.9c/L
30-day average
190.6c/L
30-day high
216.9c/L
Today's average
200.9c/L
164.0190.5217.014 July29 July13 Aug
Daily averageMin–max spread across Kings Langley stations

7-day outlook

Kings Langley 7-day U91 outlook

Falling · -21.4c/L over 7 days

Kings Langley prices follow the Central Coast cycle, so this outlook takes the Central Coast U91 forecast and adjusts it to Kings Langley's own price level using 90 days of local history. You can see the Central Coast benchmark alongside the local estimate below.

Central Coast is in the falling phase of the current model. Treat this as guidance, not a guaranteed price path.

Kings Langley today (est.)

200.8c/L

Central Coast 201.6c/L · -0.8c/L local

Modelled in 7 days

179.4c/L

7-day range

167.1 – 201.8c/L

166.0184.5203.0FriSatSunMonTueWedThu
Modelled priceLikely price range

Local brands

Fuel brands in Kings Langley

Compare each brand’s local station coverage and reported average. Individual station prices may be higher or lower.

How to use this page

Using the Kings Langley price list

Kings Langley is part of the Sydney fuel market. Use the city average to judge whether a local station report is relatively cheap or dear.

Compare recent reports for the fuel grade your vehicle uses. Widen the search only when the gross saving covers the extra distance.

Compare the same fuel grade

Kings Langley 2147 currently shows U91 at 199.9 c/L across 1 tracked station directly in Kings Langley.

Fuel-grade coverage depends on which nearby stations have recently reported prices. Use the station list and update times before making a special trip.


Before driving farther

Kings Langley is part of Sydney, within Blacktown. Compare the wider Sydney market when the cheapest local report is stale, out of the way or only a few cents lower.

Nearby suburbs with enough reports to compare include Seven Hills from 192.9c across 8 stations, Kings Park from 195.5c across 5 stations, Blacktown from 195.9c across 5 stations, Baulkham Hills from 198.9c across 3 stations, Bella Vista from 198.9c across 2 stations and Lalor Park from 198.9c across 2 stations.

Before making a detour, check the station report time and work out the gross saving from the price difference and litres you need. Prices for this area include reports from FuelCheck. Compare that station with the New South Wales state average of 201.6c.

Data updated 13 Aug, 6:21 pm AEST. Source: FuelCheck. Based on 1 station. Suburb averages can hide station-level differences. Check the selected fuel grade, report time and final pump price.

Frequently asked

Kings Langley fuel questions

Kings Langley 2147 currently shows 199.9 c/L as the lowest listed U91 price, with a local average of 199.9 c/L. Check the station update time before driving.

FuelRadar app

Save a station near Kings Langley

Save a regular station, then set a fuel target for your local area.

Download on the App StoreGet it on Google Play
How to use the app
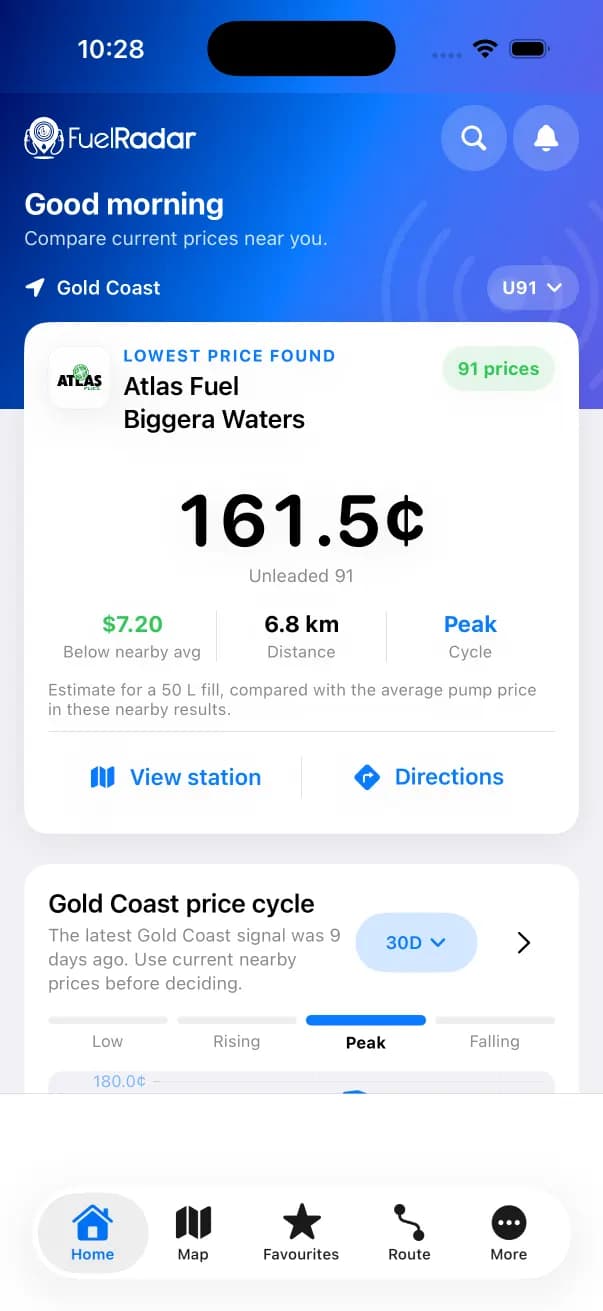
FuelRadar iPhone dashboard showing a nearby lowest price and local price-cycle status
Dashboard
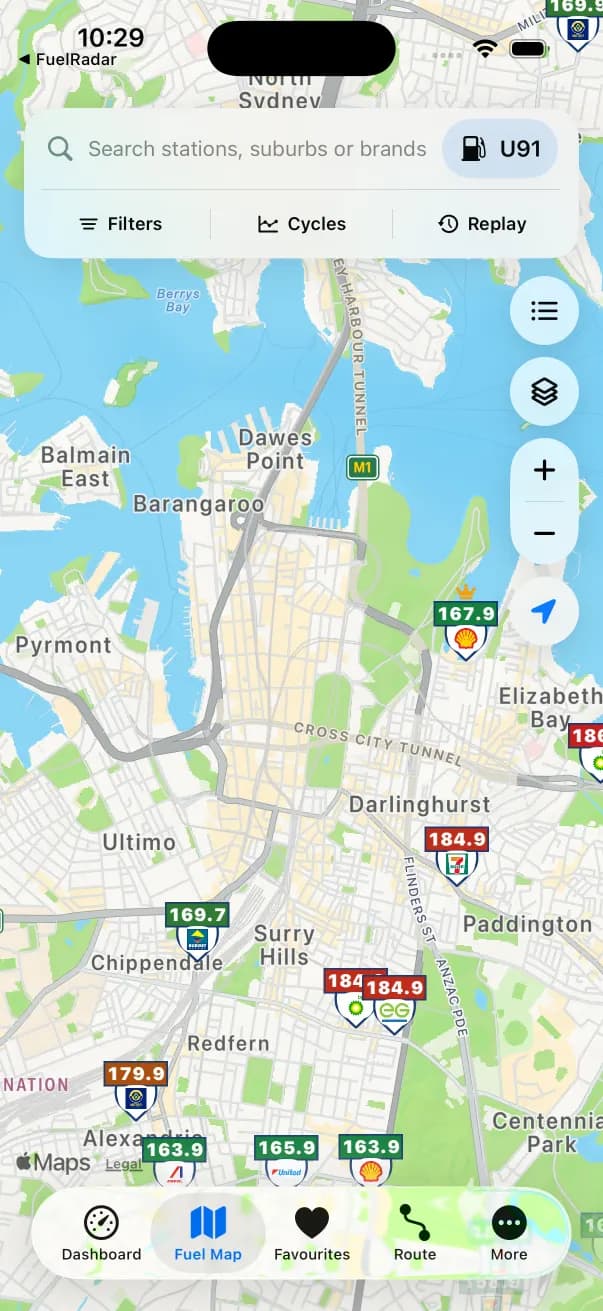
FuelRadar iPhone fuel map showing U91 price markers around Sydney
Fuel map
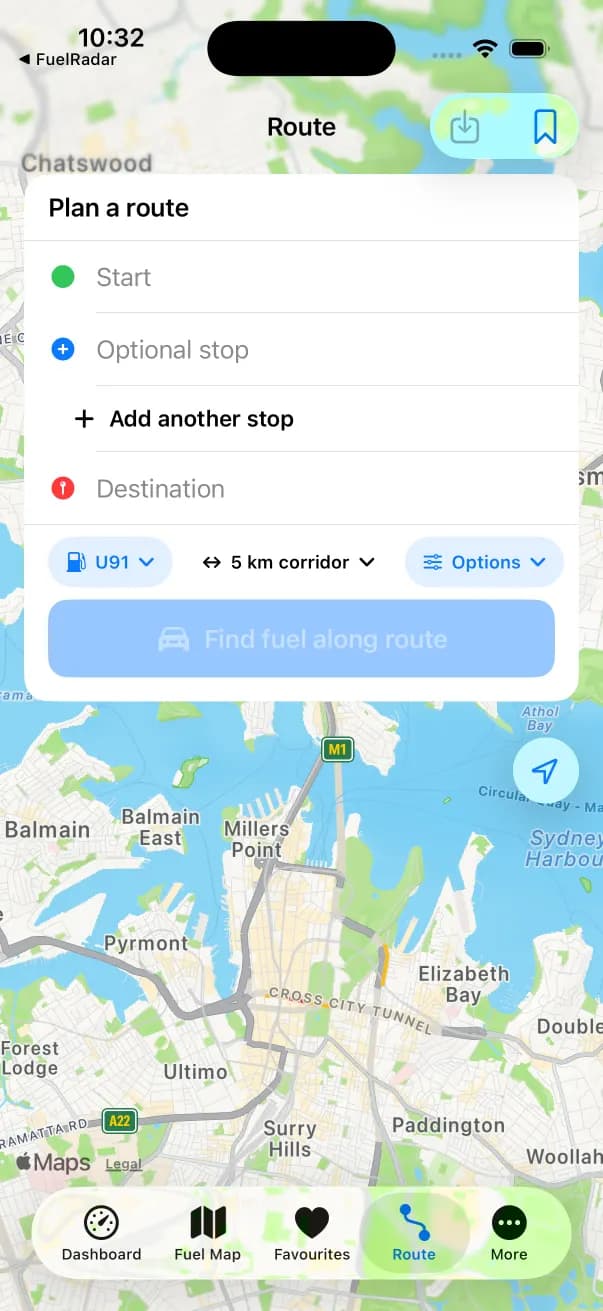
FuelRadar iPhone route planner with fuel type and route-corridor controls
Route planner

Captured from the current FuelRadar iPhone app. Prices shown are examples from the capture.