South Australia fuel prices, September quarter 2026
Prices from 1 July to 30 September 2026Updated
South Australia U91 average
203.2c/L+22.3 c/L on the partial June quarter 2026
- Adelaide U91
- 197.5c/L
- Rest of South Australia U91
- 207.9c/L
- Diesel average
- 243.7c/L
Adelaide month by month, what makes up a litre, margins, the price cycle, excise, the other capitals, and every regional town we could rank.
Comparison period: 13 April 2026 to 30 June 2026. This covers part of the calendar period. The change compares the available days, not two full calendar periods. Station coverage can also change.
Report highlights
Quote these with the credit: Source: FuelRadar Australia, South Australia fuel prices, September quarter 2026, fuelradar.com.au/fuel-price-reports/sa/2026-q3
Adelaide reported prices averaged 197.5 c/L for U91 in the September quarter 2026, up 26.4 c/L on the partial June quarter 2026.
Crafers–Bridgewater was the cheapest town in Adelaide – Central and Hills for U91 in the September quarter 2026 at 199.0 c/L, 1.5 c/L above Adelaide.
In the September quarter 2026, the day of the week made little difference to U91 prices in Adelaide: the cheapest and dearest days were 0.6 c/L apart on average.
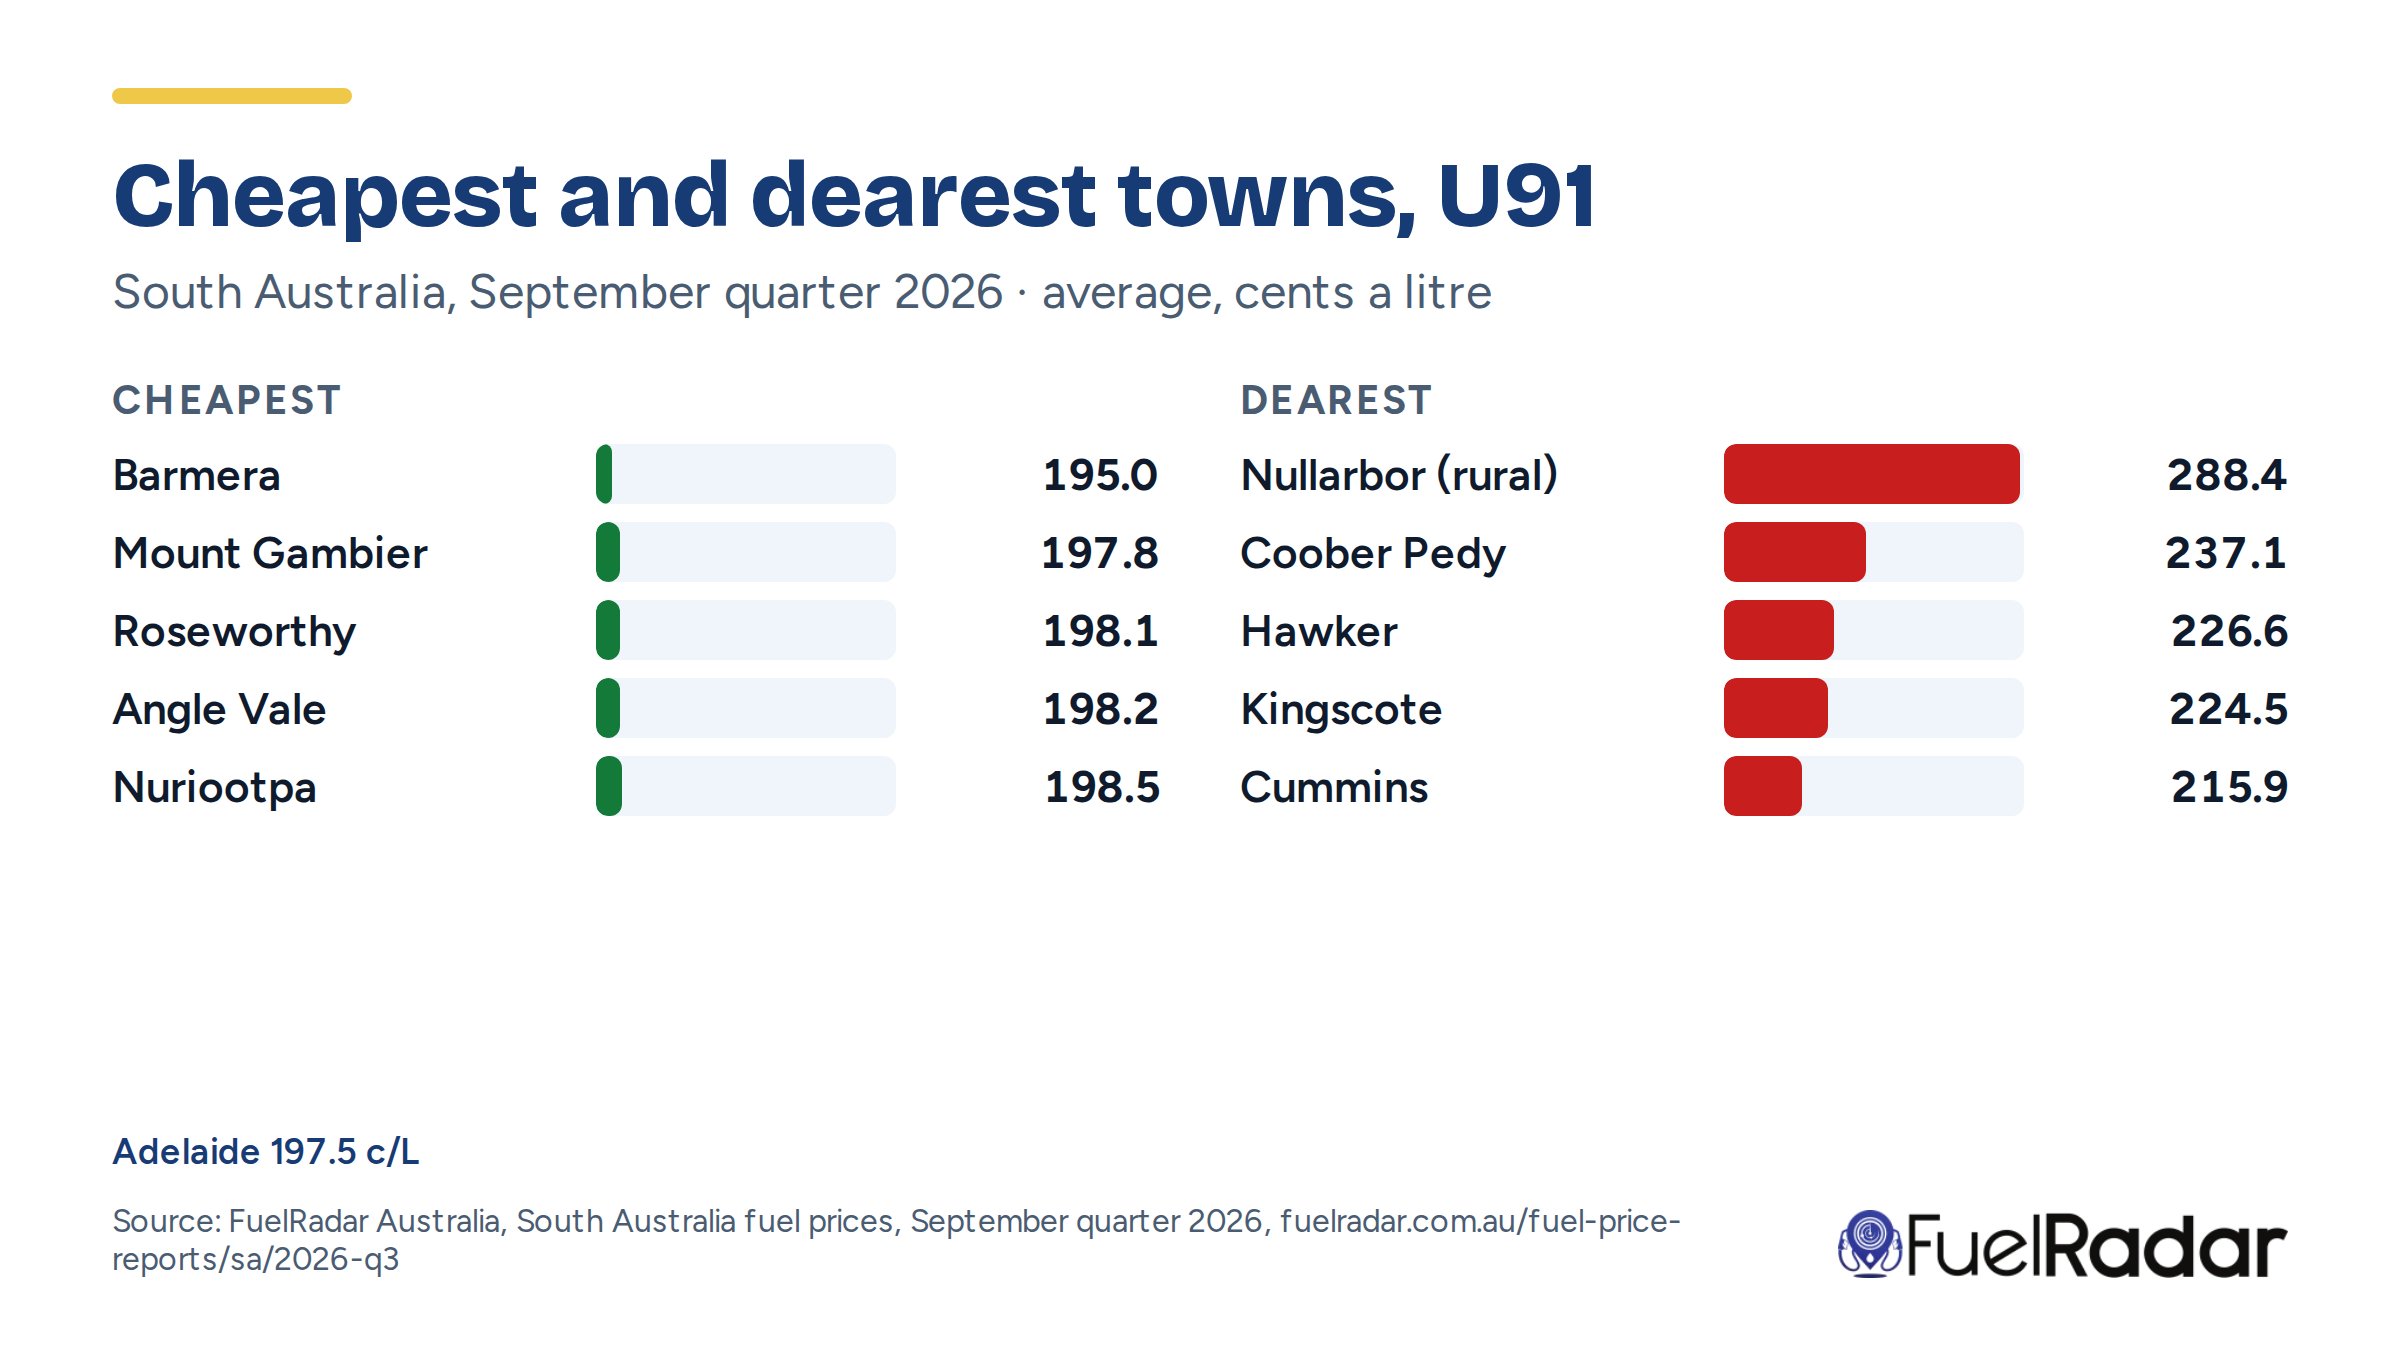
Filling a 60-litre tank with U91 in Barmera rather than in Nullarbor (rural) saved $56.04 on average in the September quarter 2026.
Independent service stations in South Australia averaged 1.2 c/L more than the major brands for U91 in the September quarter 2026, and 3.3 c/L less in Adelaide.
Diesel cost 36.4 c/L more than U91 in Adelaide in the September quarter 2026, down from 50.1 c/L in the partial June quarter 2026.
Barmera was South Australia’s cheapest town for U91 in the September quarter 2026 at 195.0 c/L, 2.5 c/L below Adelaide.
Adelaide was the cheapest of the 8 capital cities for U91 in the September quarter 2026 at 197.5 c/L.
Key points
Written from FuelRadar’s figures for this period and checked against them.
Adelaide was the cheapest of the 8 capital cities for U91, averaging 197.5 c/L over the September quarter 2026.
Adelaide was also the cheapest of the 8 capital cities for diesel, averaging 233.9 c/L.
Wholesale unleaded reached 192.6 c/L, the highest on record since AIP's series began in March quarter 2004 (nominal prices).
Wholesale diesel averaged 229.9 c/L, which is the highest on record since AIP's series began in March quarter 2004 (nominal prices).
In Adelaide, U91 prices followed wholesale costs and excise rather than a regular price cycle.
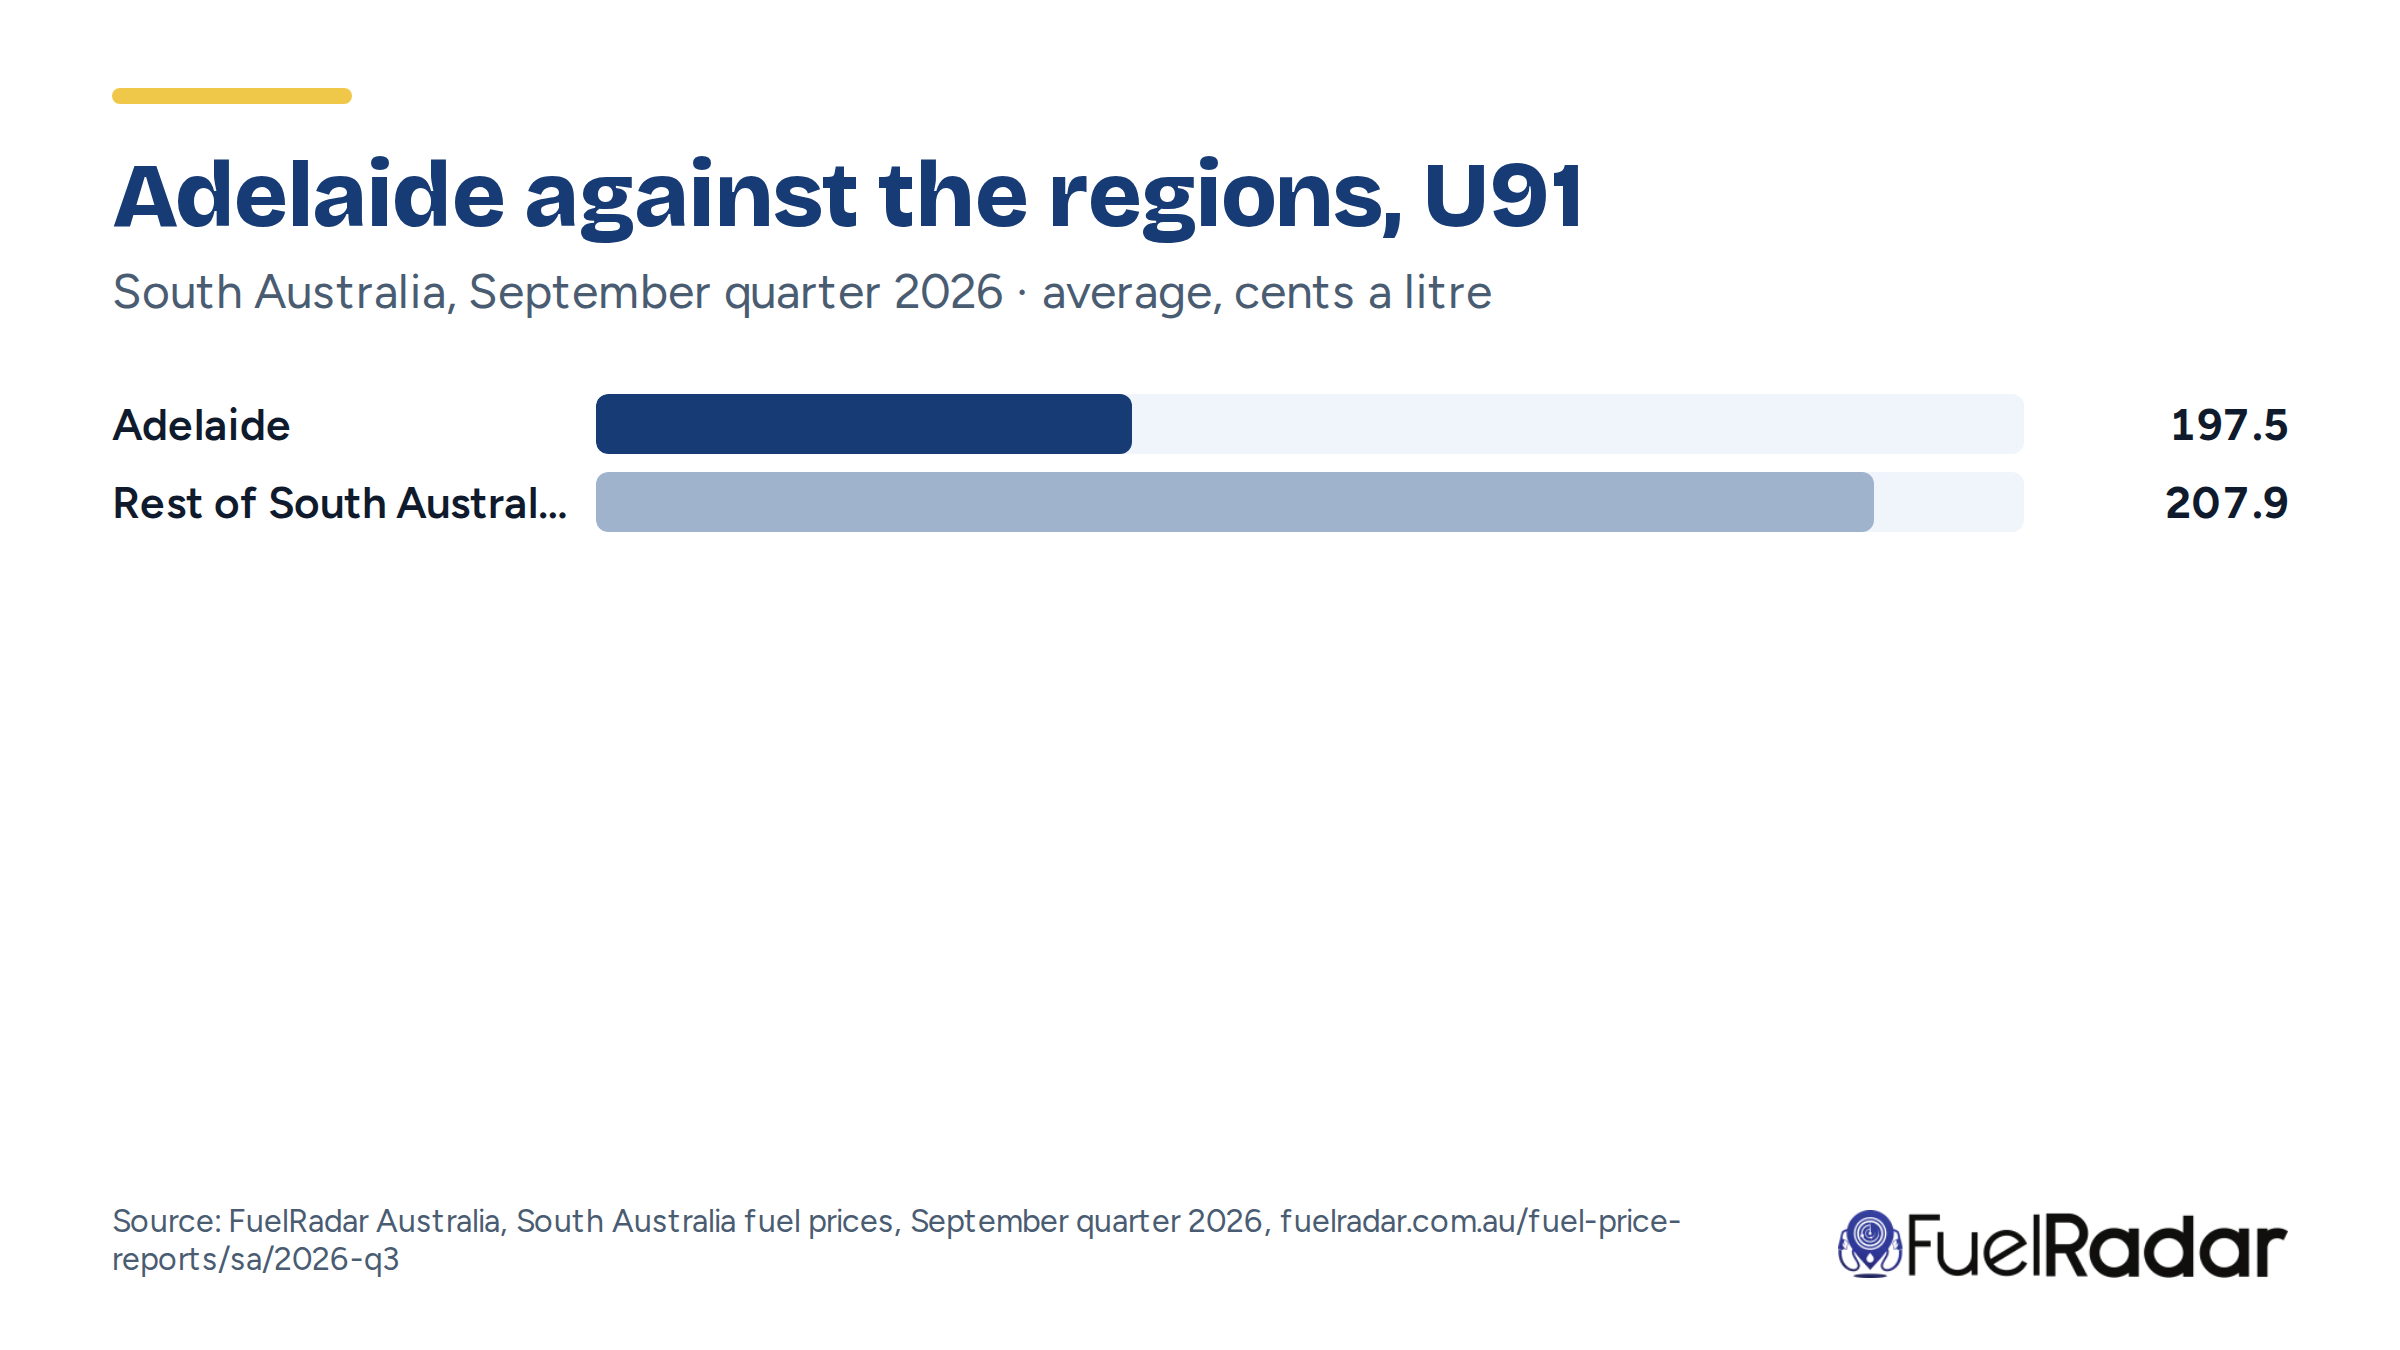
Regional drivers paid an average of 207.9 c/L for U91, which was 10.4 c/L more than the capital.
Barmera was the cheapest town in the state for U91, averaging 195 c/L across its 3 stations.
Nullarbor (rural) was the dearest town for U91, averaging 288.4 c/L at its 2 stations.
Adelaide U91 reached 234.3 c/L on 22 September 2026, setting a new high since our records began on 13 April 2026.
Diesel cost 36.4 c/L more than U91 in Adelaide during the period.
Since the financial year began on 1 July 2026, Adelaide U91 rose 74.5 c/L to reach 232.7 c/L on 30 September 2026.
Since our records began on 13 April 2026, the state average for U91 was 193.2 c/L.
Get the free FuelRadar app
Free on iPhone and Android: price alerts, saved stations, the forecast.


App preview. Prices shown are example captures, not current reports.
Every fuel in South Australia
U91 reported prices in Adelaide averaged 197.5 c/L in the September quarter 2026, up 26.4 c/L on the partial June quarter 2026 (from 13 April, when this station-price series starts). Across South Australia, U91 averaged 203.2 c/L, up 22.3 c/L on the partial June quarter 2026. Diesel reported prices in Adelaide averaged 233.9 c/L in the September quarter 2026, up 12.7 c/L on the partial June quarter 2026. Across South Australia, diesel averaged 243.7 c/L, up 10.0 c/L on the partial June quarter 2026. The other fuels averaged E10 192.0 c/L, P95 217.5 c/L, P98 226.2 c/L and LPG 114.8 c/L.
Source: FuelRadar (fuelradar.com.au)
Cents a litre. Change is on the partial June quarter 2026, which starts when our full price history does. Difference is the rest of the state against Adelaide.
Table viewwith the state average, change and stations
| Fuel | South Australia | Adelaide | Rest of state |
|---|---|---|---|
| Unleaded 91 | 203.2 | 197.5 | 207.9 |
| Diesel | 243.7 | 233.9 | 245.9 |
| E10 | 192.0 | 190.7 | 194.5 |
| Premium 95 | 217.5 | 214.4 | 223.5 |
| Premium 98 | 226.2 | 222.9 | 229.6 |
| LPG | 114.8 | 106.3 | 127.8 |
What makes up a litre in Adelaide
Of the 197.5 c/L U91 average in Adelaide, crude oil was 86.0 c/L, wholesale 41.5 c/L, excise 47.6 c/L, GST 18.0 c/L and the retail difference 4.4 c/L. Of the 233.9 c/L diesel average in Adelaide, crude oil was 86.0 c/L, wholesale 75.4 c/L, excise 47.6 c/L, GST 21.3 c/L and the retail difference 3.6 c/L. Premium 95 has no terminal gate price of its own, so its breakdown uses the unleaded price and its premium sits in the retail difference. Our retail records begin on 13 April 2026, so earlier periods show the wholesale side only.
What makes up a litre of Unleaded 91
Source: FuelRadar (fuelradar.com.au)
How we worked this out
A benchmark illustration using differently weighted period averages, not a matched purchase basket or measured retailer costs. See the same-date retail/TGP comparison separately.
Wholesale is the terminal gate price without GST and excise, less crude oil. GST is one eleventh of the retail price. The retail difference is what is left: the retailer’s costs and margin, without its GST. Bands are rounded so they add up to the retail price.
Retail: FuelRadar station-day averages for Adelaide. Our retail records begin on 13 April 2026, so a period before then has the wholesale side only, and “dearest” and “cheapest” compare the periods since our records began.
Terminal gate price: AIP, Adelaide terminal, carried over weekends. Crude oil: Brent spot (US EIA, via FRED) in Australian dollars, at 158.987 litres a barrel. Excise: ATO, averaged over the period’s days.
Every period (3 rows)
| Period | Crude oil (Brent, A$) | Wholesale: refining, shipping, terminal | Excise | GST | Retail difference | Retail price |
|---|---|---|---|---|---|---|
| September quarter 2026 | 86.0 | 41.5 | 47.6 | 18.0 | 4.4 | 197.5 |
| June quarter 2026 (part) | 88.8 | 46.3 | 20.6 | 15.6 | −0.2 | 171.1 |
| 2025 averageWholesale side only | 67.5 | 29.6 | 51.1 | — | — | — |
Month by month, U91
Adelaide's daily U91 average went from 158.2 c/L on 1 July to 232.7 c/L on 30 September, and diesel from 178.5 c/L to 288.5 c/L. The highest daily average in Adelaide was 234.3 c/L for U91 on 22 September and 290.2 c/L for diesel on 24 September. Adelaide's U91 average was 172.1 c/L in July, 202.1 c/L in August and 218.8 c/L in September. Adelaide's diesel average was 200.4 c/L in July, 240.8 c/L in August and 269.2 c/L in September.
| Area | Quarter |
|---|---|
| South Australia | 203.2 |
| Adelaide | 197.5 |
| Rest of South Australia | 207.9 |
| Adelaide NorthArea | 196.5 |
| Adelaide WestArea | 197.5 |
| Adelaide SouthArea | 197.6 |
| Adelaide – Central and HillsArea | 199.3 |
Cents a litre. Each month is the station-day average of the days it has in the period. An area’s months count the same stations as its quarter.
Month by month, diesel
Show diesel month by month
| Area | Quarter |
|---|---|
| South Australia | 243.7 |
| Adelaide | 233.9 |
| Rest of South Australia | 245.9 |
| Adelaide – Central and HillsArea | 226.9 |
| Adelaide SouthArea | 227.4 |
| Adelaide NorthArea | 234.1 |
| Adelaide WestArea | 237.6 |
Cents a litre. Each month is the station-day average of the days it has in the period. An area’s months count the same stations as its quarter.
Retail and wholesale on the same days, U91
Adelaide retail prices compared with the Adelaide terminal. This is not the delivered wholesale cost at individual stations.
| Period | Days used / window | Retail daily mean | TGP, same days | Gross spread |
|---|---|---|---|---|
| September quarter 20261 Jul to 30 Sept 2026; 26 carried TGP days. Gaps may occur within this range. | 92 / 92 | 197.4 | 192.6 | 4.9 |
| June quarter 202613 Apr to 30 Jun 2026; 22 carried TGP days. Gaps may occur within this range. | 79 / 79 | 171.8 | 171.3 | 0.4 |
Each common date counts once. Retail is the mean of the saved daily capital averages, not the station-day-weighted headline mean. TGP uses the same dates and carries the last published value for at most six subsequent calendar days. Retail prices can already include carried station prices. Means and spreads are rounded separately. The gross spread is not profit or a causal explanation. Retail carry limit: 30 days. Unmatched dates are excluded; common days are not a station or sales coverage percentage.
Retail and wholesale on the same days, Diesel
Adelaide retail prices compared with the Adelaide terminal. This is not the delivered wholesale cost at individual stations.
Show Diesel comparison
| Period | Days used / window | Retail daily mean | TGP, same days | Gross spread |
|---|---|---|---|---|
| September quarter 20261 Jul to 30 Sept 2026; 26 carried TGP days. Gaps may occur within this range. | 92 / 92 | 236.6 | 229.9 | 6.6 |
| June quarter 202613 Apr to 30 Jun 2026; 22 carried TGP days. Gaps may occur within this range. | 79 / 79 | 224.0 | 208.1 | 15.9 |
Worked out the same way as the table above.
Market trends this year
The Adelaide terminal gate price averaged 192.6 c/L for unleaded and 229.9 c/L for diesel, up 21.3 c/L and up 21.8 c/L on the partial June quarter 2026. Brent crude averaged US$96.3 a barrel, or 86.0 c/L in Australian dollars, with the Australian dollar at an average of 70.62 US cents.
Retail, terminal gate and crude oil prices this year
Source: FuelRadar (fuelradar.com.au)
How we worked this out
Retail: FuelRadar daily averages for Adelaide, from 13 April 2026 when our records begin.
Terminal gate prices (dashed): AIP, Adelaide terminal, weekdays. Brent crude: US EIA spot price via FRED, converted at each day’s exchange rate and 158.987 litres a barrel.
Daily figures (243 rows)
| Date | U91, Adelaide | Diesel, Adelaide | Unleaded terminal gate price |
|---|---|---|---|
| 30 Sept | 232.7 | 288.5 | 229.1 |
| 29 Sept | 233.0 | 288.7 | 228.6 |
| 28 Sept | 233.1 | 288.6 | 229.3 |
| 27 Sept | 233.2 | 288.6 | — |
| 26 Sept | 233.6 | 288.7 | — |
| 25 Sept | 233.6 | 289.4 | 229.5 |
| 24 Sept | 234.2 | 290.2 | 230.2 |
| 23 Sept | 234.2 | 289.3 | 230.3 |
| 22 Sept | 234.3 | 288.9 | 229.1 |
| 21 Sept | 231.7 | 283.2 | 228.0 |
| 20 Sept | 230.6 | 281.7 | — |
| 19 Sept | 230.0 | 281.2 | — |
| 18 Sept | 229.0 | 280.0 | 224.8 |
| 17 Sept | 224.5 | 273.7 | 221.7 |
| 16 Sept | 219.1 | 268.0 | 218.8 |
| 15 Sept | 217.1 | 266.7 | 214.1 |
| 14 Sept | 213.6 | 263.0 | 211.9 |
| 13 Sept | 208.5 | 257.0 | — |
| 12 Sept | 208.5 | 256.5 | — |
| 11 Sept | 208.1 | 255.8 | 210.1 |
| 10 Sept | 206.1 | 253.7 | 207.9 |
| 9 Sept | 205.7 | 253.1 | 205.3 |
| 8 Sept | 205.4 | 252.4 | 202.8 |
| 7 Sept | 205.1 | 251.6 | 201.1 |
| 6 Sept | 204.3 | 250.7 | — |
| 5 Sept | 204.2 | 250.6 | — |
| 4 Sept | 203.1 | 249.9 | 198.7 |
| 3 Sept | 202.5 | 248.4 | 196.6 |
| 2 Sept | 201.8 | 247.4 | 195.5 |
| 1 Sept | 201.8 | 247.4 | 194.8 |
| 31 Aug | 201.9 | 247.5 | 195.3 |
| 30 Aug | 202.2 | 247.7 | — |
| 29 Aug | 202.2 | 248.1 | — |
| 28 Aug | 202.2 | 248.0 | 195.5 |
| 27 Aug | 202.9 | 248.2 | 196.5 |
| 26 Aug | 203.3 | 248.5 | 196.6 |
| 25 Aug | 203.4 | 249.4 | 196.4 |
| 24 Aug | 203.6 | 249.1 | 196.1 |
| 23 Aug | 203.9 | 248.1 | — |
| 22 Aug | 203.4 | 247.9 | — |
| 21 Aug | 203.3 | 247.9 | 195.4 |
| 20 Aug | 201.8 | 244.6 | 194.7 |
| 19 Aug | 200.9 | 243.6 | 194.2 |
| 18 Aug | 199.7 | 243.0 | 193.4 |
| 17 Aug | 199.1 | 241.3 | 192.8 |
| 16 Aug | 198.1 | 240.3 | — |
| 15 Aug | 197.6 | 239.5 | — |
| 14 Aug | 197.0 | 238.2 | 191.1 |
| 13 Aug | 197.3 | 234.2 | 189.8 |
| 12 Aug | 198.8 | 232.2 | 189.8 |
| 11 Aug | 200.5 | 232.9 | 191.0 |
| 10 Aug | 203.9 | 236.4 | 192.8 |
| 9 Aug | 206.6 | 238.1 | — |
| 8 Aug | 207.5 | 238.5 | — |
| 7 Aug | 208.0 | 238.9 | 196.5 |
| 6 Aug | 209.0 | 239.6 | 198.4 |
| 5 Aug | 208.0 | 238.6 | 198.7 |
| 4 Aug | 205.9 | 236.8 | 198.2 |
| 3 Aug | 201.2 | 233.6 | 203.5 |
| 2 Aug | 196.3 | 229.8 | — |
| 1 Aug | 196.1 | 229.3 | — |
| 31 July | 194.4 | 227.7 | 183.8 |
| 30 July | 193.6 | 227.3 | 184.2 |
| 29 July | 192.5 | 226.0 | 183.8 |
| 28 July | 192.0 | 225.7 | 183.0 |
| 27 July | 189.4 | 223.8 | 180.8 |
| 26 July | 187.1 | 219.9 | — |
| 25 July | 185.3 | 219.0 | — |
| 24 July | 182.2 | 216.6 | 177.6 |
| 23 July | 179.7 | 214.8 | 174.5 |
| 22 July | 176.5 | 211.6 | 173.2 |
| 21 July | 174.1 | 208.0 | 170.2 |
| 20 July | 171.3 | 205.3 | 168.5 |
| 19 July | 169.3 | 202.6 | — |
| 18 July | 168.9 | 201.5 | — |
| 17 July | 167.6 | 199.5 | 166.5 |
| 16 July | 165.4 | 196.4 | 164.2 |
| 15 July | 163.8 | 192.6 | 161.7 |
| 14 July | 163.2 | 189.5 | 160.3 |
| 13 July | 163.3 | 187.9 | 160.3 |
| 12 July | 163.1 | 186.5 | — |
| 11 July | 163.1 | 185.6 | — |
| 10 July | 162.9 | 184.9 | 160.6 |
| 9 July | 162.6 | 184.0 | 161.9 |
| 8 July | 162.3 | 184.1 | 162.8 |
| 7 July | 163.2 | 184.5 | 163.8 |
| 6 July | 164.2 | 185.7 | 164.2 |
| 5 July | 165.5 | 186.0 | — |
| 4 July | 165.5 | 186.3 | — |
| 3 July | 165.1 | 186.2 | 163.7 |
| 2 July | 160.7 | 182.2 | 163.1 |
| 1 July | 158.2 | 178.5 | 162.3 |
| 30 June | 154.6 | 175.0 | 146.8 |
| 29 June | 148.7 | 171.0 | 146.8 |
| 28 June | 148.6 | 171.0 | — |
| 27 June | 148.5 | 172.3 | — |
| 26 June | 148.9 | 174.0 | 147.8 |
| 25 June | 149.8 | 177.6 | 148.3 |
| 24 June | 150.5 | 179.2 | 148.5 |
| 23 June | 151.3 | 181.2 | 150.6 |
| 22 June | 152.4 | 183.4 | 151.3 |
| 21 June | 153.6 | 185.7 | — |
| 20 June | 154.3 | 186.4 | — |
| 19 June | 155.0 | 187.7 | 153.5 |
| 18 June | 156.4 | 190.7 | 156.7 |
| 17 June | 157.1 | 194.0 | 159.1 |
| 16 June | 158.0 | 196.0 | 161.4 |
| 15 June | 158.5 | 198.2 | 161.2 |
| 14 June | 158.2 | 199.5 | — |
| 13 June | 158.4 | 199.9 | — |
| 12 June | 158.5 | 199.9 | 160.5 |
| 11 June | 158.4 | 200.0 | 159.9 |
| 10 June | 158.4 | 200.2 | 158.9 |
| 9 June | 158.6 | 200.7 | 158.6 |
| 8 June | 159.1 | 201.1 | 158.7 |
| 7 June | 159.1 | 201.6 | — |
| 6 June | 159.3 | 201.8 | — |
| 5 June | 159.4 | 201.8 | 159.5 |
| 4 June | 160.6 | 202.6 | 159.6 |
| 3 June | 162.7 | 204.8 | 161.8 |
| 2 June | 167.8 | 209.0 | 164.2 |
| 1 June | 168.8 | 210.4 | 166.5 |
| 31 May | 169.8 | 211.8 | — |
| 30 May | 170.3 | 212.9 | — |
| 29 May | 170.6 | 213.3 | 169.5 |
| 28 May | 172.2 | 215.5 | 172.2 |
| 27 May | 173.3 | 216.9 | 175.2 |
| 26 May | 175.5 | 219.6 | 178.8 |
| 25 May | 176.5 | 221.5 | 180.1 |
| 24 May | 176.9 | 222.7 | — |
| 23 May | 176.8 | 222.9 | — |
| 22 May | 176.7 | 223.1 | 180.7 |
| 21 May | 177.2 | 223.9 | 180.2 |
| 20 May | 176.7 | 224.9 | 178.4 |
| 19 May | 176.7 | 225.3 | 175.1 |
| 18 May | 175.2 | 225.5 | 173.1 |
| 17 May | 175.0 | 225.9 | — |
| 16 May | 183.5 | 226.1 | — |
| 15 May | 181.6 | 226.2 | 172.0 |
| 14 May | 174.3 | 226.7 | 172.2 |
| 13 May | 175.0 | 228.3 | 173.0 |
| 12 May | 176.2 | 230.0 | 175.6 |
| 11 May | 177.7 | 232.6 | 178.1 |
| 10 May | 179.4 | 233.2 | — |
| 9 May | 180.3 | 235.8 | — |
| 8 May | 180.3 | 236.1 | 181.2 |
| 7 May | 179.8 | 237.1 | 182.0 |
| 6 May | 179.3 | 237.6 | 181.5 |
| 5 May | 177.8 | 238.3 | 182.5 |
| 4 May | 176.8 | 238.7 | 182.4 |
| 3 May | 175.8 | 239.1 | — |
| 2 May | 175.0 | 239.4 | — |
| 1 May | 175.0 | 239.5 | 182.4 |
| 30 Apr | 174.9 | 240.4 | 181.4 |
| 29 Apr | 174.8 | 242.1 | 180.0 |
| 28 Apr | 174.9 | 243.2 | 179.1 |
| 27 Apr | 175.3 | 246.7 | 179.1 |
| 26 Apr | 175.8 | 246.6 | — |
| 25 Apr | 176.8 | 248.2 | — |
| 24 Apr | 177.1 | 248.9 | 179.4 |
| 23 Apr | 177.8 | 252.9 | 181.6 |
| 22 Apr | 180.9 | 261.3 | 183.6 |
| 21 Apr | 187.0 | 274.1 | 186.3 |
| 20 Apr | 191.3 | 283.2 | 187.6 |
| 19 Apr | 196.1 | 290.6 | — |
| 18 Apr | 198.1 | 291.3 | — |
| 17 Apr | 199.8 | 291.4 | 190.4 |
| 16 Apr | 204.3 | 295.6 | 191.8 |
| 15 Apr | 209.5 | 300.4 | 195.7 |
| 14 Apr | 216.3 | 314.6 | 198.7 |
| 13 Apr | 217.3 | 316.9 | 201.3 |
| 10 Apr | — | — | 205.4 |
| 9 Apr | — | — | 208.6 |
| 8 Apr | — | — | 207.8 |
| 7 Apr | — | — | 203.8 |
| 6 Apr | — | — | 203.8 |
| 3 Apr | — | — | 204.6 |
| 2 Apr | — | — | 205.3 |
| 1 Apr | — | — | 205.9 |
| 31 Mar | — | — | 230.9 |
| 30 Mar | — | — | 242.7 |
| 27 Mar | — | — | 247.3 |
| 26 Mar | — | — | 249.8 |
| 25 Mar | — | — | 248.5 |
| 24 Mar | — | — | 244.3 |
| 23 Mar | — | — | 242.2 |
| 20 Mar | — | — | 237.2 |
| 19 Mar | — | — | 234.6 |
| 18 Mar | — | — | 230.0 |
| 17 Mar | — | — | 224.4 |
| 16 Mar | — | — | 218.8 |
| 13 Mar | — | — | 210.4 |
| 12 Mar | — | — | 204.9 |
| 11 Mar | — | — | 193.9 |
| 10 Mar | — | — | 188.4 |
| 9 Mar | — | — | 174.8 |
| 6 Mar | — | — | 168.3 |
| 5 Mar | — | — | 162.0 |
| 4 Mar | — | — | 159.6 |
| 3 Mar | — | — | 157.5 |
| 2 Mar | — | — | 156.9 |
| 27 Feb | — | — | 156.0 |
| 26 Feb | — | — | 155.5 |
| 25 Feb | — | — | 154.7 |
| 24 Feb | — | — | 153.1 |
| 23 Feb | — | — | 152.0 |
| 20 Feb | — | — | 151.8 |
| 19 Feb | — | — | 152.4 |
| 18 Feb | — | — | 152.9 |
| 17 Feb | — | — | 153.6 |
| 16 Feb | — | — | 154.0 |
| 13 Feb | — | — | 153.8 |
| 12 Feb | — | — | 153.2 |
| 11 Feb | — | — | 152.6 |
| 10 Feb | — | — | 152.3 |
| 9 Feb | — | — | 152.2 |
| 6 Feb | — | — | 152.1 |
| 5 Feb | — | — | 152.3 |
| 4 Feb | — | — | 152.6 |
| 3 Feb | — | — | 153.2 |
| 2 Feb | — | — | 153.2 |
| 30 Jan | — | — | 152.5 |
| 29 Jan | — | — | 152.9 |
| 28 Jan | — | — | 153.3 |
| 27 Jan | — | — | 153.4 |
| 26 Jan | — | — | 153.4 |
| 23 Jan | — | — | 153.4 |
| 22 Jan | — | — | 153.5 |
| 21 Jan | — | — | 153.7 |
| 20 Jan | — | — | 153.5 |
| 19 Jan | — | — | 153.6 |
| 16 Jan | — | — | 153.1 |
| 15 Jan | — | — | 152.5 |
| 14 Jan | — | — | 152.3 |
| 13 Jan | — | — | 152.2 |
| 12 Jan | — | — | 152.2 |
| 9 Jan | — | — | 152.7 |
| 8 Jan | — | — | 153.3 |
| 7 Jan | — | — | 153.8 |
| 6 Jan | — | — | 154.3 |
| 5 Jan | — | — | 154.5 |
| 2 Jan | — | — | 154.7 |
| 1 Jan | — | — | 154.7 |
Adelaide against the rest of South Australia
Adelaide averaged 197.5 c/L for U91 and the rest of South Australia 207.9 c/L, so reported prices in the rest of South Australia averaged 10.4 c/L more than Adelaide. Adelaide averaged 233.9 c/L for diesel and the rest of South Australia 245.9 c/L, so reported prices in the rest of South Australia averaged 12.0 c/L more than Adelaide.
Source: FuelRadar (fuelradar.com.au)
Daily averages (92 rows)
| Date | Adelaide (c/L) | Rest of South Australia (c/L) |
|---|---|---|
| 30 Sept | 232.7 | 244.2 |
| 29 Sept | 233.0 | 244.2 |
| 28 Sept | 233.1 | 244.2 |
| 27 Sept | 233.2 | 244.2 |
| 26 Sept | 233.6 | 244.3 |
| 25 Sept | 233.6 | 244.3 |
| 24 Sept | 234.2 | 244.1 |
| 23 Sept | 234.2 | 243.5 |
| 22 Sept | 234.3 | 242.2 |
| 21 Sept | 231.7 | 240.3 |
| 20 Sept | 230.6 | 238.9 |
| 19 Sept | 230.0 | 238.2 |
| 18 Sept | 229.0 | 237.0 |
| 17 Sept | 224.5 | 232.6 |
| 16 Sept | 219.1 | 228.1 |
| 15 Sept | 217.1 | 224.9 |
| 14 Sept | 213.6 | 221.9 |
| 13 Sept | 208.5 | 219.0 |
| 12 Sept | 208.5 | 218.9 |
| 11 Sept | 208.1 | 218.1 |
| 10 Sept | 206.1 | 216.1 |
| 9 Sept | 205.7 | 215.3 |
| 8 Sept | 205.4 | 214.7 |
| 7 Sept | 205.1 | 214.1 |
| 6 Sept | 204.3 | 213.5 |
| 5 Sept | 204.2 | 213.7 |
| 4 Sept | 203.1 | 213.3 |
| 3 Sept | 202.5 | 213.3 |
| 2 Sept | 201.8 | 213.3 |
| 1 Sept | 201.8 | 213.4 |
| 31 Aug | 201.9 | 213.5 |
| 30 Aug | 202.2 | 213.6 |
| 29 Aug | 202.2 | 213.6 |
| 28 Aug | 202.2 | 213.7 |
| 27 Aug | 202.9 | 213.8 |
| 26 Aug | 203.3 | 213.7 |
| 25 Aug | 203.4 | 213.6 |
| 24 Aug | 203.6 | 213.5 |
| 23 Aug | 203.9 | 213.1 |
| 22 Aug | 203.4 | 212.8 |
| 21 Aug | 203.3 | 212.4 |
| 20 Aug | 201.8 | 211.8 |
| 19 Aug | 200.9 | 211.0 |
| 18 Aug | 199.7 | 210.7 |
| 17 Aug | 199.1 | 210.1 |
| 16 Aug | 198.1 | 209.7 |
| 15 Aug | 197.6 | 209.6 |
| 14 Aug | 197.0 | 209.4 |
| 13 Aug | 197.3 | 210.0 |
| 12 Aug | 198.8 | 210.8 |
| 11 Aug | 200.5 | 211.5 |
| 10 Aug | 203.9 | 212.9 |
| 9 Aug | 206.6 | 213.9 |
| 8 Aug | 207.5 | 214.0 |
| 7 Aug | 208.0 | 214.2 |
| 6 Aug | 209.0 | 214.1 |
| 5 Aug | 208.0 | 213.0 |
| 4 Aug | 205.9 | 210.8 |
| 3 Aug | 201.2 | 206.7 |
| 2 Aug | 196.3 | 202.6 |
| 1 Aug | 196.1 | 202.3 |
| 31 July | 194.4 | 201.1 |
| 30 July | 193.6 | 200.2 |
| 29 July | 192.5 | 199.2 |
| 28 July | 192.0 | 198.4 |
| 27 July | 189.4 | 195.7 |
| 26 July | 187.1 | 193.8 |
| 25 July | 185.3 | 192.6 |
| 24 July | 182.2 | 191.5 |
| 23 July | 179.7 | 189.2 |
| 22 July | 176.5 | 186.9 |
| 21 July | 174.1 | 185.2 |
| 20 July | 171.3 | 183.2 |
| 19 July | 169.3 | 181.4 |
| 18 July | 168.9 | 181.2 |
| 17 July | 167.6 | 180.2 |
| 16 July | 165.4 | 179.2 |
| 15 July | 163.8 | 178.3 |
| 14 July | 163.2 | 178.2 |
| 13 July | 163.3 | 178.1 |
| 12 July | 163.1 | 178.0 |
| 11 July | 163.1 | 178.1 |
| 10 July | 162.9 | 178.2 |
| 9 July | 162.6 | 178.5 |
| 8 July | 162.3 | 178.2 |
| 7 July | 163.2 | 178.5 |
| 6 July | 164.2 | 178.7 |
| 5 July | 165.5 | 178.6 |
| 4 July | 165.5 | 178.1 |
| 3 July | 165.1 | 177.4 |
| 2 July | 160.7 | 174.9 |
| 1 July | 158.2 | 172.7 |
The price cycle in Adelaide
- No price-cycle hike in Adelaide was detected under the margin-based rule in this period. This does not establish why retail prices changed.
- Adelaide’s daily U91 average less the Adelaide terminal gate price is the indicative margin, not profit. A hike requires this margin and the retail average each to rise by at least 8.0 c/L within 5 days. Where station-rise counts are available, daily rises of at least 5.0 c/L, summed over the rise, must reach 25% of the station count at the peak; a station can count on more than one day. Rises within 3 days of an excise change are excluded. The margin must then ease by at least half within 21 days; if follow-up is too short, a counted hike can have unconfirmed easing. A regular cycle requires at least two detected hikes. No detected hike does not establish why retail prices changed.
Fuel excise
Fuel excise on petrol and diesel changed from 20.6 c/L to 36.6 c/L on 1 July 2026 and from 36.6 c/L to 53.7 c/L on 3 August 2026. Over the period it averaged 47.6 c/L a litre, before GST.
| Petrol and diesel excise | Rate (c/L, before GST) | Change |
|---|---|---|
| In force on 1 July 2026 | 36.6 | — |
| From 1 July 2026Partial restoration; still a temporarily reduced rate, 1 July to 2 August 2026 | 36.6 | +16.0 |
| From 3 August 2026Full rate restored, indexed by the CPI factor of 1.020 | 53.7 | +17.1 |
| Average over the days of 1 July to 30 September 2026 | 47.57 | — |
Excise is charged on fuel as it leaves the terminal, so it is already in the terminal gate price; GST is then charged on top.
Source: ATO: Excise duty rates for fuel and petroleum products
The capital cities, U91
Adelaide ranked the cheapest of the 8 capital cities for U91; Adelaide was the cheapest at 197.5 c/L and Canberra the dearest at 206.5 c/L. Adelaide ranked the cheapest of the 8 capital cities for diesel; Adelaide was the cheapest at 233.9 c/L and Canberra the dearest at 248.2 c/L.
Cents a litre, cheapest first. Each capital is its ABS urban area, worked out exactly as in its own state’s report. The margin is against its own terminal’s gate price (Canberra uses Sydney’s). Period-average margins are omitted here: comparable daily inputs and weights are not retained for these rows.
The capital cities, diesel
Show the capital cities, diesel
Cents a litre, cheapest first. Each capital is its ABS urban area, worked out exactly as in its own state’s report. The margin is against its own terminal’s gate price (Canberra uses Sydney’s). Period-average margins are omitted here: comparable daily inputs and weights are not retained for these rows.
Adelaide by area
Inside Adelaide, Adelaide North was the cheapest area for U91 at 196.5 c/L and Adelaide – Central and Hills the dearest at 199.3 c/L, a spread of 2.8 c/L.
- Adelaide North196.5 (lowest)
- Adelaide West197.5
- Adelaide South197.6
- Adelaide – Central and Hills199.3
Cents a litre, cheapest U91 first. Areas are the ABS Statistical Areas Level 4 (SA4) inside Adelaide’s urban area, named in plain words (“Brisbane - East” is Brisbane East). An area counts its stations that reported on at least a quarter of the days; its average, station count and cheapest station all come from them. Period-average margins are omitted here: comparable daily inputs and weights are not retained for these rows.
Table viewwith diesel and the cheapest station
| Area (ABS SA4) | U91 | Diesel |
|---|---|---|
| Adelaide North | 196.5 | 234.1 |
| Adelaide West | 197.5 | 237.6 |
| Adelaide South | 197.6 | 227.4 |
| Adelaide – Central and Hills | 199.3 | 226.9 |
Regional towns ranked, U91
The cheapest U91 outside Adelaide was in Barmera, at 195.0 c/L, 2.5 c/L below Adelaide. At the other end, Nullarbor (rural) averaged 288.4 c/L, 90.9 c/L above Adelaide. 1 of the 59 towns we ranked averaged less than Adelaide for U91. Barmera was the cheapest regional town for diesel at 233.0 c/L and Nullarbor (rural) the dearest at 315.8 c/L, a spread of 82.8 c/L.
Source: FuelRadar (fuelradar.com.au)
Cents a litre, cheapest first. A town is ranked with at least two stations reporting through the period and a price on most days; 124 smaller places were left out. The cheapest station’s figure is its own average over the period.
Table viewwith the stations and the cheapest station
| Town | Quarter | Against Adelaide |
|---|---|---|
| Barmera | 195.0 | −2.5 |
| Mount Gambier | 197.8 | +0.3 |
| Roseworthy | 198.1 | +0.6 |
| Angle Vale | 198.2 | +0.7 |
| Nuriootpa | 198.5 | +1.0 |
| Gawler | 198.6 | +1.1 |
| Balaklava | 198.9 | +1.4 |
| Cowell | 198.9 | +1.4 |
| Berri | 199.0 | +1.5 |
| Crafers–Bridgewater | 199.0 | +1.5 |
| Angaston | 199.1 | +1.6 |
| Victor Harbor | 200.2 | +2.7 |
| Virginia | 200.2 | +2.7 |
| Strathalbyn | 200.3 | +2.8 |
| Tintinara | 200.4 | +2.9 |
| Edithburgh | 200.9 | +3.4 |
| Keith | 201.5 | +4.0 |
| Waikerie | 201.6 | +4.1 |
| Kapunda | 201.7 | +4.2 |
| Mount Barker | 202.0 | +4.5 |
| Port Wakefield | 202.0 | +4.5 |
| Meadows | 202.4 | +4.9 |
| Port Vincent | 202.6 | +5.1 |
| Bordertown | 203.1 | +5.6 |
| Tailem Bend | 203.1 | +5.6 |
| Lameroo | 203.4 | +5.9 |
| Murray Bridge | 204.0 | +6.5 |
| Mannum | 204.5 | +7.0 |
| Burra | 204.7 | +7.2 |
| Port Augusta | 204.7 | +7.2 |
| Gladstone | 205.4 | +7.9 |
| Loxton | 205.5 | +8.0 |
| Maitland | 205.5 | +8.0 |
| Yorketown | 205.9 | +8.4 |
| Eudunda | 206.2 | +8.7 |
| Clare | 206.3 | +8.8 |
| Laura | 206.6 | +9.1 |
| Wilmington | 206.7 | +9.2 |
| Jamestown | 207.2 | +9.7 |
| Yunta (rural) | 207.2 | +9.7 |
| Kadina | 207.9 | +10.4 |
| Port Lincoln | 208.0 | +10.5 |
| Renmark | 208.0 | +10.5 |
| Warnertown (rural) | 208.3 | +10.8 |
| Port Pirie | 208.5 | +11.0 |
| Wallaroo | 208.6 | +11.1 |
| Kingston SE | 209.2 | +11.7 |
| Naracoorte | 209.3 | +11.8 |
| Moonta | 209.9 | +12.4 |
| Whyalla | 210.0 | +12.5 |
| Tumby Bay | 210.1 | +12.6 |
| Streaky Bay | 211.0 | +13.5 |
| Goolwa | 211.1 | +13.6 |
| Ceduna | 211.9 | +14.4 |
| Cummins | 215.9 | +18.4 |
| Kingscote | 224.5 | +27.0 |
| Hawker | 226.6 | +29.1 |
| Coober Pedy | 237.1 | +39.6 |
| Nullarbor (rural) | 288.4 | +90.9 |
Regional towns ranked, diesel
Source: FuelRadar (fuelradar.com.au)
Cents a litre, cheapest first. A town is ranked with at least two stations reporting through the period and a price on most days; 120 smaller places were left out. The cheapest station’s figure is its own average over the period.
Table viewwith the stations and the cheapest station
| Town | Quarter | Against Adelaide |
|---|---|---|
| Barmera | 233.0 | −0.9 |
| Cowell | 233.7 | −0.2 |
| Tintinara | 234.8 | +0.9 |
| Port Vincent | 235.0 | +1.1 |
| Berri | 235.4 | +1.5 |
| Edithburgh | 235.4 | +1.5 |
| Mount Gambier | 235.4 | +1.5 |
| Keith | 235.8 | +1.9 |
| Lameroo | 236.8 | +2.9 |
| Balaklava | 237.0 | +3.1 |
| Renmark | 237.9 | +4.0 |
| Roseworthy | 238.2 | +4.3 |
| Victor Harbor | 238.4 | +4.5 |
| Tailem Bend | 238.9 | +5.0 |
| Bordertown | 239.1 | +5.2 |
| Yorketown | 239.1 | +5.2 |
| Port Wakefield | 239.2 | +5.3 |
| Meningie | 239.7 | +5.8 |
| Port Augusta West (rural) | 239.7 | +5.8 |
| Angaston | 239.8 | +5.9 |
| Ardrossan | 240.0 | +6.1 |
| Gladstone | 240.2 | +6.3 |
| Kimba | 240.4 | +6.5 |
| Crafers–Bridgewater | 240.6 | +6.7 |
| Wilmington | 240.7 | +6.8 |
| Port Lincoln | 240.9 | +7.0 |
| Strathalbyn | 241.1 | +7.2 |
| Burra | 241.6 | +7.7 |
| Port Augusta | 241.8 | +7.9 |
| Loxton | 242.0 | +8.1 |
| Mount Barker | 242.0 | +8.1 |
| Booleroo Centre | 242.1 | +8.2 |
| Peterborough | 242.1 | +8.2 |
| Yunta (rural) | 242.3 | +8.4 |
| Pinnaroo | 242.7 | +8.8 |
| Jamestown | 242.9 | +9.0 |
| Laura | 243.2 | +9.3 |
| Two Wells (rural) | 243.4 | +9.5 |
| Clare | 243.6 | +9.7 |
| Kadina | 243.8 | +9.9 |
| Eudunda | 243.9 | +10.0 |
| Wudinna | 243.9 | +10.0 |
| Streaky Bay | 244.8 | +10.9 |
| Murray Bridge | 245.2 | +11.3 |
| Meadows | 245.5 | +11.6 |
| Kingston SE | 245.7 | +11.8 |
| Tumby Bay | 245.7 | +11.8 |
| Port Pirie | 246.0 | +12.1 |
| Warnertown (rural) | 246.0 | +12.1 |
| Cummins | 246.2 | +12.3 |
| Naracoorte | 246.5 | +12.6 |
| Ceduna | 246.7 | +12.8 |
| Whyalla | 246.9 | +13.0 |
| Robe | 247.4 | +13.5 |
| Moonta | 250.5 | +16.6 |
| Lock (rural) | 251.6 | +17.7 |
| Goolwa | 255.2 | +21.3 |
| Kingscote | 260.0 | +26.1 |
| Hawker | 263.0 | +29.1 |
| Lyndhurst (rural) | 271.8 | +37.9 |
| Coober Pedy | 280.0 | +46.1 |
| Nullarbor (rural) | 315.8 | +81.9 |
Other fuels: cheapest and dearest towns
| Fuel | Cheapest town (c/L) | Dearest town (c/L) |
|---|---|---|
| E10 | Barmera 188.5 | Mount Gambier 189.7 |
| Premium 95 | Angle Vale 214.4 | Nullarbor (rural) 301.2 |
| Premium 98 | Balaklava 216.6 | Coober Pedy 259.6 |
| LPG | Gawler 108.0 | Mount Gambier 122.5 |
Fewer stations sell these fuels, so fewer towns are ranked.
Regional centres, U91
Mount Gambier was the cheapest of the 10 regional centres we ranked for U91 at 197.8 c/L, and Whyalla the dearest at 210.0 c/L. 0 of them averaged less than Adelaide.
| Centre | Quarter | Against Adelaide |
|---|---|---|
| Mount Gambier | 197.8 | +0.3 |
| Gawler | 198.6 | +1.1 |
| Crafers–Bridgewater | 199.0 | +1.5 |
| Victor Harbor | 200.2 | +2.7 |
| Mount Barker | 202.0 | +4.5 |
| Murray Bridge | 204.0 | +6.5 |
| Port Augusta | 204.7 | +7.2 |
| Port Lincoln | 208.0 | +10.5 |
| Port Pirie | 208.5 | +11.0 |
| Whyalla | 210.0 | +12.5 |
Cents a litre, cheapest first. A regional centre is a large regional city we map on its own, or an ABS urban centre of 10,000 people or more (2021 Census) outside Adelaide.
Against Adelaide, month by month, U91
Adelaide North averaged 196.5 c/L for U91, 1.0 c/L below Adelaide, and was cheaper than Adelaide in 6 of 6 months since our records began on 13 April 2026. Adelaide West averaged 197.5 c/L for U91, the same as Adelaide, and was cheaper than Adelaide in 3 of 6 months since our records began on 13 April 2026. Adelaide South averaged 197.6 c/L for U91, 0.1 c/L above Adelaide, and was cheaper than Adelaide in 0 of 6 months since our records began on 13 April 2026. Adelaide – Central and Hills averaged 199.3 c/L for U91, 1.8 c/L above Adelaide, and was cheaper than Adelaide in 0 of 6 months since our records began on 13 April 2026.
| Area | Quarter | Against Adelaide | Year so far | Months cheaper |
|---|---|---|---|---|
| Adelaide North | 196.5 | −1.0 | −0.9 | 6 of 6 |
| Adelaide West | 197.5 | 0.0 | +0.1 | 3 of 6 |
| Adelaide South | 197.6 | +0.1 | +0.4 | 0 of 6 |
| Adelaide – Central and Hills | 199.3 | +1.8 | +1.6 | 0 of 6 |
Cents a litre; negative is cheaper than Adelaide. The areas are Adelaide’s ABS SA4 areas and the regional centres of 50,000 people or more.
Cheapest and dearest in each area, U91
Roseworthy was the cheapest town in Adelaide North for U91 at 198.1 c/L and Virginia the dearest at 200.2 c/L. Crafers–Bridgewater was the cheapest town in Adelaide – Central and Hills for U91 at 199.0 c/L and Meadows the dearest at 202.4 c/L. Of the suburbs and towns we ranked, the widest spread was in Outback South Australia: Cowell at 198.9 c/L to Nullarbor at 288.4 c/L, a gap of 89.5 c/L.
| Area | Cheapest suburb or town |
|---|---|
| Adelaide NorthAdelaide area | Klemzig192.8 c/L |
| Adelaide SouthAdelaide area | Old Noarlunga193.6 c/L |
| Adelaide WestAdelaide area | Port Adelaide193.6 c/L |
| Adelaide – Central and HillsAdelaide area | Nailsworth194.4 c/L |
| Barossa – Yorke – Mid North | Nuriootpa198.5 c/L |
| Outback South Australia | Cowell198.9 c/L |
| South Australia South East | Barmera195.0 c/L |
A suburb or town is the ABS locality a station sits in, ranked within its SA4 by the same rule as the towns.
The year so far: since our records began on 13 April 2026
Since our records began on 13 April 2026, U91 has averaged 193.2 c/L across South Australia and 185.4 c/L in Adelaide; Angle Vale has been the cheapest town at 185.5 c/L, and 0 of the 59 towns we ranked have averaged less than Adelaide.
| Fuel | South Australia | Adelaide | Rest of South Australia |
|---|---|---|---|
| U91 | 193.2 | 185.4 | 199.6 |
| Diesel | 239.2 | 227.8 | 241.9 |
0 of the 59 towns we ranked averaged less than Adelaide for U91.
Cheapest towns since our records began on 13 April 2026, U91
| Town | Average | Against Adelaide |
|---|---|---|
| Angle Vale | 185.5 | +0.1 |
| Barmera | 185.9 | +0.5 |
| Gawler | 186.2 | +0.8 |
| Roseworthy | 186.2 | +0.8 |
| Crafers–Bridgewater | 187.1 | +1.7 |
| Nuriootpa | 187.5 | +2.1 |
| Virginia | 187.5 | +2.1 |
| Strathalbyn | 188.0 | +2.6 |
| Mount Gambier | 188.9 | +3.5 |
| Mount Barker | 190.0 | +4.6 |
Dearest towns since our records began on 13 April 2026, U91
| Town | Average | Against Adelaide |
|---|---|---|
| Nullarbor (rural) | 283.1 | +97.7 |
| Coober Pedy | 240.5 | +55.1 |
| Hawker | 218.3 | +32.9 |
| Kingscote | 217.4 | +32.0 |
| Streaky Bay | 210.6 | +25.2 |
| Cummins | 210.5 | +25.1 |
| Ceduna | 204.7 | +19.3 |
| Goolwa | 203.5 | +18.1 |
| Tumby Bay | 203.2 | +17.8 |
| Moonta | 202.0 | +16.6 |
The day of the week to buy U91
In the September quarter 2026, Sunday was the cheapest day to buy U91 in Adelaide and Saturday the dearest, 0.6 c/L apart on average; since our records began on 13 April 2026, Wednesday has been the cheapest.
| Place | Cheapest / dearest, quarter |
|---|---|
| Adelaide | Sunday / Saturday0.6 c/L apart |
| GawlerRegional centre | Wednesday / Monday0.7 c/L apart |
| Mount BarkerRegional centre | Sunday / Tuesday0.8 c/L apart |
| Mount GambierRegional centre | Sunday / Friday0.7 c/L apart |
| WhyallaRegional centre | Monday / Saturday0.5 c/L apart |
| Crafers–BridgewaterRegional centre | Monday / Thursday0.5 c/L apart |
| Murray BridgeRegional centre | Sunday / Friday0.5 c/L apart |
| Port AugustaRegional centre | Monday / Saturday0.5 c/L apart |
| Port LincolnRegional centre | Monday / Thursday0.5 c/L apart |
| Port PirieRegional centre | Monday / Thursday0.7 c/L apart |
| Victor HarborRegional centre | Wednesday / Monday0.7 c/L apart |
Each day’s average against the seven days centred on it, averaged by weekday, so a steady rise or fall does not favour one end of the week. A place needs four of each weekday with prices from five stations or more; a month usually shows the year so far only.
What a 60-litre tank of U91 saved
Filling a 60-litre tank with U91 in Barmera rather than Nullarbor (rural) saved $56.04 on average in the September quarter 2026. In Barmera the same tank cost $1.50 less than in Adelaide. At Costco Kilburn in Kilburn, the cheapest station we ranked, it cost $10.68 less than at the state average.
| Comparison | Cheaper | Dearer | A tank |
|---|---|---|---|
| Cheapest and dearest town | Barmera195.0 c/L | Nullarbor (rural)288.4 c/L | $56.04 |
| Cheapest and dearest regional centre | Mount Gambier197.8 c/L | Whyalla210.0 c/L | $7.32 |
| Cheapest town and Adelaide | Barmera195.0 c/L | Adelaide197.5 c/L | $1.50 |
| Cheapest station and the state average | Costco Kilburn185.4 c/L | South Australia203.2 c/L | $10.68 |
Towns that moved most on the partial June quarter 2026, U91
Angle Vale rose most on the partial June quarter 2026, up 27.7 c/L to 198.2 c/L, while Coober Pedy fell most, down 8.1 c/L to 237.1 c/L.
| Town | Quarter | Change |
|---|---|---|
| Angle ValeRose | 198.2 | +27.7 |
| VirginiaRose | 200.2 | +27.5 |
| GawlerRose | 198.6 | +27.4 |
| StrathalbynRose | 200.3 | +26.6 |
| Mount BarkerRose | 202.0 | +26.3 |
| Coober PedyFell | 237.1 | −8.1 |
Independents and the major brands, U91
Independent service stations averaged 204.0 c/L for U91 and the major brands 202.8 c/L, 1.2 c/L more at the independents; in Adelaide the gap was 3.3 c/L. Of the brands with five stations or more, U-Go averaged least at 191.6 c/L and Mogas most at 216.0 c/L.
| Where | Major brands | Independents | Difference |
|---|---|---|---|
| South Australia | 202.8 | 204.0 | +1.2 |
| Adelaide | 198.3 | 195.0 | −3.3 |
| U-GoIndependent | — | 191.6 | — |
| SoloIndependent | — | 193.1 | — |
| UnitedMajor brand | 196.0 | — | — |
| X ConvenienceIndependent | — | 197.0 | — |
| LibertyIndependent | — | 199.2 | — |
| CaltexMajor brand | 200.8 | — | — |
| On The Run (OTR)Major brand | 200.8 | — | — |
| AM/PMIndependent | — | 201.2 | — |
| Reddy ExpressMajor brand | 203.7 | — | — |
| AmpolMajor brand | 203.9 | — | — |
| ShellMajor brand | 205.7 | — | — |
| BPMajor brand | 206.6 | — | — |
| PerrysIndependent | — | 209.9 | — |
| MobilMajor brand | 210.2 | — | — |
| IndependentIndependent | — | 211.0 | — |
| MogasIndependent | — | 216.0 | — |
The major brands are 7-Eleven, Ampol, BP, Caltex, EG, Mobil, On The Run (OTR), Reddy Express, Shell and United; every other brand, and a station without one, is independent. Stations with a price on a quarter of the days; a brand is listed with five or more.
Cheapest service stations, U91
Costco Kilburn in Kilburn was the cheapest service station we ranked for U91 at 185.4 c/L, and Pink Roadhouse in Oodnadatta the dearest at 318.6 c/L.
| Station | Place | Average |
|---|---|---|
| Costco KilburnCostco | Kilburn | 185.4 |
| Mount Burr General Store and LiquorIndependent | Mount Burr | 188.6 |
| United Melrose ParkUnited | Melrose Park | 190.3 |
| U-Go ClearviewU-Go | Enfield | 190.6 |
| U-Go St MarysU-Go | St Marys | 190.6 |
| Leroy’s Munno ParaIndependent | Smithfield | 190.9 |
| Ampol Foodary EdwardstownAmpol | Edwardstown | 191.2 |
| Leroy’s HackhamIndependent | Hackham | 191.3 |
| Liberty Clarence GardensLiberty | Clarence Gardens | 191.4 |
| APCO Mount GambierApco Service Stations | Mount Gambier | 191.5 |
Dearest service stations, U91
| Station | Place | Average |
|---|---|---|
| Pink RoadhouseIndependent | Oodnadatta | 318.6 |
| Nullarbor RoadhouseMobil | Nullarbor | 290.1 |
| Border Village RoadhouseBP | Nullarbor | 286.8 |
| Leigh Creek MotorsPerrys | Leigh Creek | 255.3 |
| Cadney Homestead RoadhouseMobil | Tieyon | 252.8 |
| Marla Travellers RestBP | Marla | 252.4 |
| Arkaroola Wilderness SanctuaryMogas | Arkaroola Village | 250.4 |
| Smoky Bay General StoreIndependent | Smoky Bay | 244.8 |
| Vivonne Bay General Store & Bottle ShopIndependent | Vivonne Bay | 242.2 |
| Cooke's Outback MotorsIndependent | Copley | 238.2 |
Diesel against U91
Diesel cost 36.4 c/L more than U91 in Adelaide, against 50.1 c/L on the partial June quarter 2026. Among the towns, the gap was narrowest in Nullarbor (rural) at 27.4 c/L and widest in Goolwa at 44.1 c/L.
| Where | Diesel less U91 |
|---|---|
| Adelaide | 36.4 |
| South Australia | 40.5 |
| Rest of South Australia | 38.0 |
| Nullarbor (rural)Narrowest gap | 27.4 |
| RenmarkNarrowest gap | 29.9 |
| CumminsNarrowest gap | 30.3 |
| Port VincentNarrowest gap | 32.4 |
| Port LincolnNarrowest gap | 32.9 |
| GoolwaWidest gap | 44.1 |
| MeadowsWidest gap | 43.1 |
| Coober PedyWidest gap | 42.9 |
| Crafers–BridgewaterWidest gap | 41.6 |
| Murray BridgeWidest gap | 41.2 |
Crude oil and the dollar
Brent crude averaged US$96.3 a barrel in the September quarter 2026, against US$63.7 in the December quarter 2025.
| Period | Brent, US$ a barrel | US$ per A$ | Brent, A$ c/L |
|---|---|---|---|
| September quarter 2026 | 96.3 | 0.7062 | 86.0 |
| June quarter 2026 | 102.6 | 0.7101 | 91.1 |
| March quarter 2026 | 80.7 | 0.6956 | 73.3 |
| December quarter 2025 | 63.7 | 0.6568 | 61.0 |
Brent: Europe Brent spot price FOB (US Energy Information Administration). Exchange rate: the Federal Reserve’s noon buying rate in New York. Both via FRED, Federal Reserve Bank of St. Louis, averaged over the days each is published; the Australian-dollar figures use each day’s rate. A litre is a barrel divided by 158.987. We use these free benchmarks because the refined-petrol and diesel benchmarks Australian wholesale prices follow (Singapore) are sold by subscription.
Data quality, method and sources
We counted 688 distinct stations with eligible input prices, including carried prices, over 186,801 station–fuel–days across published fuels. Our price records begin on 13 April 2026.
| Coverage | Figure |
|---|---|
| Service stations listed | 705 |
| Stations with an eligible input price | 688 |
| Station–fuel–days counted (published fuels) | 186,801 |
| Days covered | 1 July 2026 to 30 September 2026 |
| Station-price records used here begin | 13 April 2026 |
| Towns ranked for U91124 left out: too few steady stations | 59 |
Coverage by fuel and period
| Fuel and period | Distinct stations | Station–fuel–days | Calendar days |
|---|---|---|---|
| U91, September quarter 20261 Jul to 30 Sept 2026 | 630 | 56,800 | 92 |
| U91, June quarter 202613 Apr to 30 Jun 2026 | 630 | 46,739 | 79 |
| E10, September quarter 20261 Jul to 30 Sept 2026 | 48 | 4,402 | 92 |
| E10, June quarter 202613 Apr to 30 Jun 2026 | 48 | 3,761 | 79 |
| DSL, September quarter 20261 Jul to 30 Sept 2026 | 389 | 33,790 | 92 |
| DSL, June quarter 202613 Apr to 30 Jun 2026 | 386 | 27,987 | 79 |
| P95, September quarter 20261 Jul to 30 Sept 2026 | 358 | 32,393 | 92 |
| P95, June quarter 202613 Apr to 30 Jun 2026 | 357 | 26,999 | 79 |
| P98, September quarter 20261 Jul to 30 Sept 2026 | 548 | 49,535 | 92 |
| P98, June quarter 202613 Apr to 30 Jun 2026 | 549 | 40,959 | 79 |
| LPG, September quarter 20261 Jul to 30 Sept 2026 | 134 | 9,881 | 92 |
| LPG, June quarter 202613 Apr to 30 Jun 2026 | 121 | 3,574 | 79 |
The listed count is the inventory used at build time, not a historical census of every operating station. One station selling two fuels on one day contributes two station–fuel–days. Fuel-specific counts must not be added to obtain a distinct station total. Distinct stations contributing eligible prices for this fuel and period. Calendar days describe the window, not new observations.
About this edition
How we worked out these figures, and our sources · What this edition can establish
How we worked out these figures, and our sources
What the average measures
Reported station-day prices, not purchases. Each station counts once per day with an eligible price; stations with more covered days contribute more. The mean is not weighted by litres sold and does not measure what the average driver paid.
Which history this uses
This report's station-price records begin on 13 April 2026. The separately published daily city-average series can begin earlier and use different boundaries and carry rules. Compare figures within the same series.
Coverage and carry
Adelaide uses its ABS urban area. An eligible price can be carried forward for up to 30 days. A covered day can therefore contain an earlier reported price. Station-days are observations, not distinct stations. The report does not quantify the share of carried prices or all excluded reports.
Wholesale spreads
Retail less terminal gate price is a gross indicative spread, not profit. It also covers transport, site and operating costs. Brent is a crude-oil benchmark, not a refined petrol or diesel price.
How we average
Each day, every service station counts once at its latest price as of the end of that day. A price is carried forward for at most 30 days, and the average is taken over every station-day in the period, so a station that reported all period counts more than one that reported for a week.
Towns and areas
Adelaide is its ABS urban area, split into ABS SA4 areas. Outside it, a town is the locality a station sits in; a station in another large city counts in that city as one place.
Which prices count
Prices held for checking, prices a station reported as unavailable and implausible prices are left out. A station’s next report ends its previous price.
Coverage
688 stations had an eligible input price in the period, including carried prices.
Wholesale, margins and the cost of a litre
The terminal gate price is AIP’s weekday price at the Adelaide terminal; AIP publishes the capital-city terminals only. Weekday prices are carried over weekends, and a period’s price is the mean of its calendar days. The margin is the retail average less the terminal gate price. In the cost of a litre, crude oil is Brent in Australian dollars, wholesale is the terminal gate price without GST and excise less crude oil, excise is the ATO rate averaged over the days, GST is one eleventh of the retail price, and the retail difference is the rest.
Sources
FuelRadar: station-day averages, areas and the price cycle, from the prices service stations report to their state’s price service. Australian Institute of Petroleum: terminal gate prices. US Energy Information Administration, via FRED: Brent crude. Federal Reserve, via FRED: the exchange rate. Australian Taxation Office: excise rates. Australian Bureau of Statistics: the urban area, SA4 and locality boundaries.
About these prices
These are averages over the whole period, not today’s prices. Check the station price and its update time before you fill.
What this edition can establish
Not recorded
Carried retail price counts and excluded raw report counts were not retained; their shares are unavailable. The number of stations selling each fuel and litres sold are not recorded, so fuel-market and sales coverage percentages are unavailable.
Saved edition
Saved 15 October 2026 at 9:39 pm, method version 2, PDF publication 7. The fingerprint identifies the saved data, not editorial changes. The PDF publication number does not supply a retained revision history.
Data fingerprint
9ae5208dd5d7d9b3f844d128055482af62fc9d318ffc17d19a7338e0e72156c7
For media
In short
Adelaide reported prices averaged 197.5 c/L for U91 in the September quarter 2026, up 26.4 c/L on the partial June quarter 2026. Crafers–Bridgewater was the cheapest town in Adelaide – Central and Hills for U91 in the September quarter 2026 at 199.0 c/L, 1.5 c/L above Adelaide.
Credit line
Source: FuelRadar Australia, South Australia fuel prices, September quarter 2026, fuelradar.com.au/fuel-price-reports/sa/2026-q3
Media enquiries
Email [email protected]. Figures, graphics and the PDF are free to use in news coverage with the credit line.